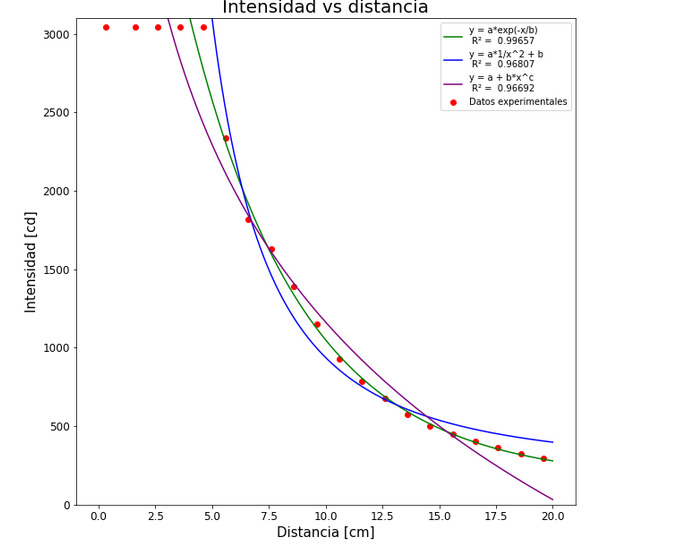
any of you may be familiar with the inverse square law for a spherical wave. The thing is that I did the experimental measurements and I was shocked to find out that the data doesn't behave that way. Actually, it fits exceptionally well to a decreasing exponential. I was thinking that the reason for this is that a flashlight isn't a punctual light source, then the light doesn't behave as a spherical wave. Also, the flashlight gathers light inside a cone, where we can spect some interference.
I searched online for a solution for this problem and dint find why it is that behaves exponentially. I think it could maybe be derived from an inhomogeneous wave equation but haven't been successful in finding that exponential behavior.
Does someone know how to derive these, or why this happens?
 Intensity vs distance plot of experimental data with some different fits. The first 5 points can be ignored since the sensor was saturated.
EDIT
Thanks to all of the responses I managed to solve the mystery. It turns out that indeed the sensor was saturated. I did the measurements for a range of 20 - 90 cm and it fitted perfectly 1/r^2. Then, I did the measurements in a range of 8 - 20 cm with a linear polarizer on the front to reduce light intensity in half and also fitted very well. Then, it Was the sensor's fault. I made sure that light wasn't polarized at the start. And yes, the flashlight was shining through air.
