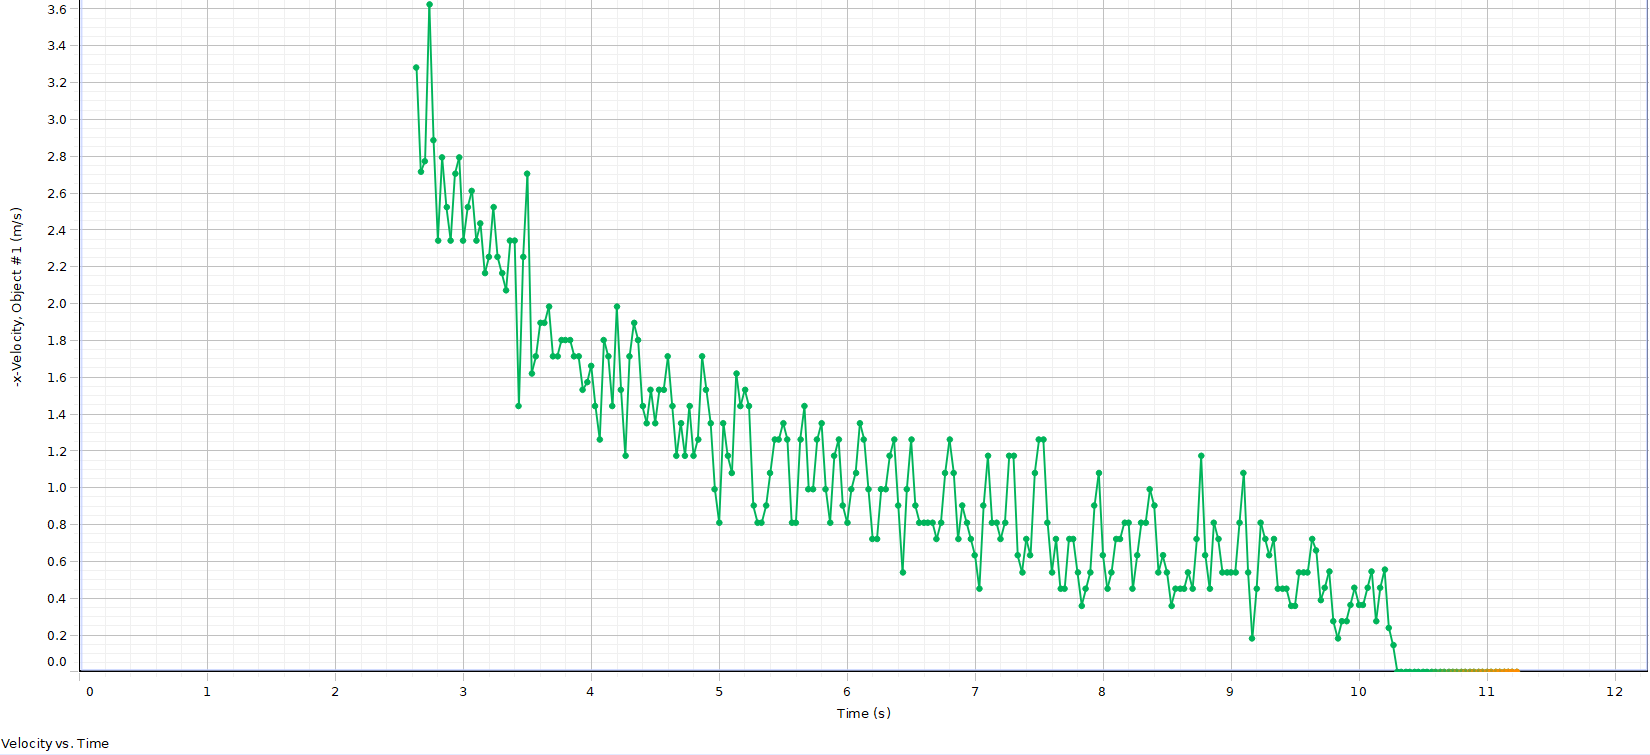
I took a video of a swimmer pushing off of the wall and gliding through the water until they come to a stop. Using some video analysis software, I was able to plot data points for their velocity over time.

I would like to fit this data to a curve, but am not sure what type of relationship it should be. I know that the only acceleration that the swimmer experiences is from drag, which is modeled by the equation $$F=\frac{1}{2}\rho v^{2}C_dA$$ Where $\rho$=density of the water, v=velocity of the swimmer relative to the water, $C_d$=drag coefficient, and A=reference area. This suggests that acceleration (since F=ma) is proportional to $v^2$. However, according to the SUVAT equations, $$v=u+at$$ Where u=initial velocity. I'm not too sure how to continue deriving the relationship between v and t. I'm thinking it could be exponential, inverse, or inverse squared, but I don't really have any reasoning behind those guesses.
