39
$\begingroup$

All the graphs shown below come from completely different fields of studies and still, they share a similar distribution pattern.

  1. Why most distribution curves Bell Shaped? Is there any physical law that leads the curve to take that shape?

  2. Is there any explanation in Quantum Mechanics for these various graphs to take that shape?

  3. Is there any intuitive explanation behind why these graphs are Bell Shaped?

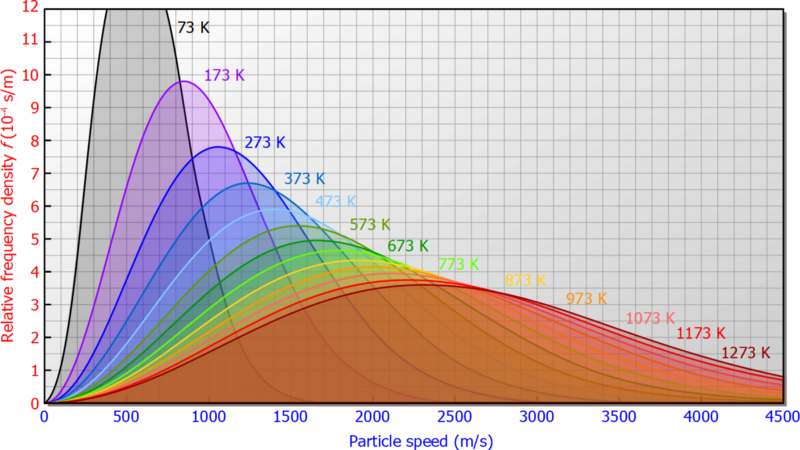
Following is Maxwell’s Distribution of Velocity Curve, in Kinetic Theory of Gases.

enter image description here

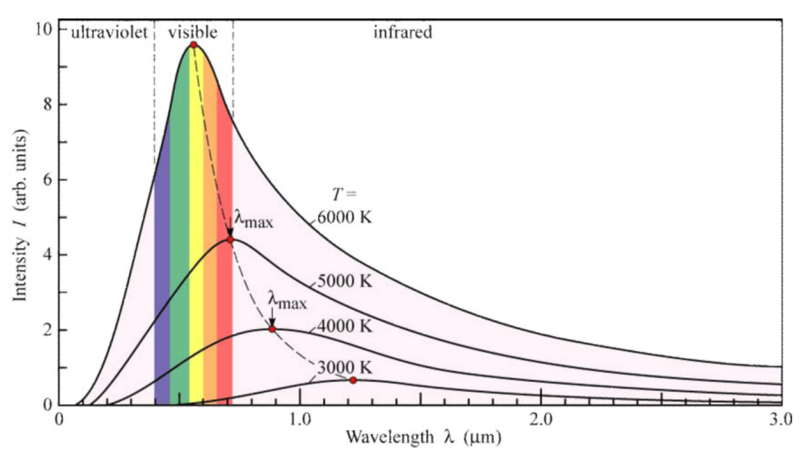
Following is the Wein’s Displacement Law, in Thermal Radiations.

enter image description here

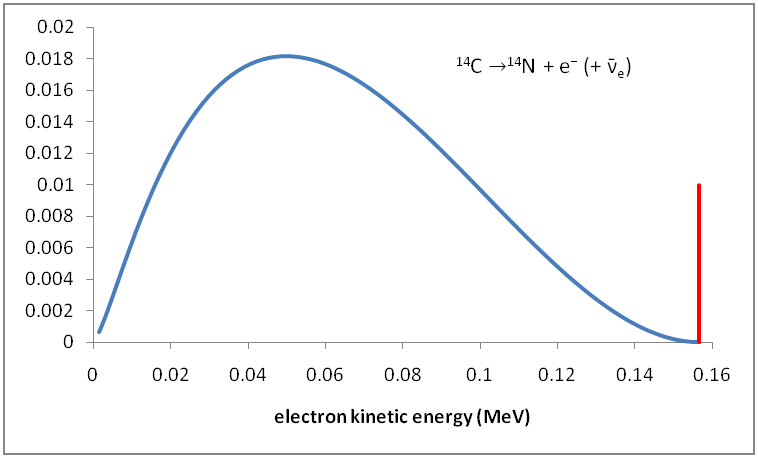
Following is the Distribution of Kinetic Energy of Beta Particles in Radioactive Decays.

enter image description here

$\endgroup$
16
  • 15
    $\begingroup$ en.wikiquote.org/wiki/Henri_Poincar%C3%A9 - Henri Poincare:"Tout le monde y croit cependant, me disait un jour M. Lippmann, car les expérimentateurs s'imaginent que c'est un théorème de mathématiques, et les mathématiciens que c'est un fait expérimental." (Everyone is sure of this [that errors are normally distributed], Mr. Lippman told me one day, since the experimentalists believe that it is a mathematical theorem, and the mathematicians that it is an experimentally determined fact.) $\endgroup$
    – hyportnex
    Commented Dec 28, 2019 at 19:12
  • 26
    $\begingroup$ Not all of the curves you are showing are bell curves, i.e., normal distribution curves, as the curves in the last two diagrams are not symmetrical as a normal distribution curve is. $\endgroup$
    – Bob D
    Commented Dec 28, 2019 at 19:47
  • 6
    $\begingroup$ Because extremes are less likely, and two peaks are unusual? $\endgroup$
    – Greg
    Commented Dec 28, 2019 at 19:58
  • 3
    $\begingroup$ More to do with measurement than physical processes, a distribution of means tends to become normal. Not individual measurements, but averages of many measurements. The underlying distribution can be flat, triangular, whatever. But some measurements will be high, some low, some in-between. It's unlikely that they will all be either high or low, the means will usually be closer to the middle. $\endgroup$
    – Greg
    Commented Dec 28, 2019 at 20:08
  • 3
    $\begingroup$ I may be over-simplifying it (and may be totally wrong), but I believe a bell curve always(?) results from a combination of multiple random linear probabilities that aren't otherwise associated with each other, so it's going to be amazingly common. If you roll a single die you get a "line", but any other number of dice summed up is going to give you a bell curve. it's just how "Plus" looks in probabilities. $\endgroup$
    – Bill K
    Commented Dec 30, 2019 at 17:43

4 Answers 4

58
$\begingroup$

First, distributions are not always bell-shaped. A very important set of distributions decrease from a maximum at $x=0$, such as the exponential distribution (delay times until a random event such as a radioactive decay) or power-laws (size distributions of randomly fragmenting objects, earthquakes, ore grade, and many other things).

Stable distributions

Still, there is a suspicious similarity between many distributions. These come about because of statistical laws that make them "attractors": various very different random processes go on, but their results tend to combine to form similar distributions. As Bob mentioned, the central limit theorem makes addition of independent random factors (of finite variance!) approach a Gaussian distribution (since it is so common it is called the normal distribution). Strictly speaking, there are a few other possibilities. If random factors are instead multiplied, the result is the log-normal distribution. If we take the maximum of some random things, the distribution will approach a Weibull distribution (or, a few others). Basically, many repeated or complex processes tend to produce the same distributions over and over again, and many of those look like bell-shapes.

Maximum entropy distributions

Why is that? The deep answer is entropy maximization. These stable distributions tend to maximize the entropy of the random values they produce, subject to some constraint. If you have something positive and with a specified mean, you get the exponential distribution. If it is positive but there is no preferred scale, you get a power-law. Specified mean and variance: Gaussian. Maximal entropy in phase space for given mean energy: Maxwell-Boltzmann.

Statistical mechanics

This is where we get back to physics. A lot of physical processes obey statistical mechanics, which runs by the equal a priori probability postulate:

For an isolated system with an exactly known energy and exactly known composition, the system can be found with equal probability in any microstate consistent with that knowledge.

If we know the energy and number of particles exactly each allowed microstate is equally likely (maximizes entropy), but anything macroscopic we calculate or measure will be a function of these random microstates - so its distribution will be bunched up if there are a lot of microstates that can generate that macrostate. If it has fixed particles but we only know the average energy, each state has probability $(1/Z)e^{-E/k_B T}$ where $E$ is their energy, $Z$ is a normalizing constant and $T$ the temperature: this distribution, the Boltzmann distribution, maximizes entropy with the constraint that the average energy is fixed. Similar distributions work when the number of particles can change.

Quantum mechanics

Finally, this links to quantum mechanics: QM describes the set of possible microstates, and from that plus statistical mechanics one can calculate the statistical distributions of macroscopic things like emitted photons of different wavelengths, gas molecule speeds, or kinetic energy distributions. The number of states available affect what curves we get, and the constraints of the experiment fix parameters like energy or temperature, but since nature is entropy-maximizing we get the entropy-maximizing distributions that fit these inputs.

They are often loosely bell-shaped since there are more states available for high energies (the curve grows from low values at low energy) but the system cannot put all particles into high energy states while keeping the (average) energy constant (the curve has to decline beyond a certain point). But this is the average of a myriad micro-events that all have more complex or discrete distributions.

$\endgroup$
3
  • $\begingroup$ Does physics offer examples of alpha-stable heavy-tailed distributions other than Cauchy-Lorentz? Kolmogorov must have looked into this question, but I don't know what he concluded. $\endgroup$ Commented Dec 29, 2019 at 11:56
  • $\begingroup$ @BertBarrois - I was wondering the same thing. I think the stable distributions do show up in anomalous diffusion, and apparently in solar flare waiting times and quasistatic pressure line broadening. Generally, they seem to show up when systems have more complex parts than vanilla statistical mechanics, perhaps because you need processes with some memory to get them. I bet they are hiding in turbulence (first google hit: log-stable distribution in turbulence. Yup). $\endgroup$ Commented Dec 29, 2019 at 16:34
  • 1
    $\begingroup$ It is perhaps worth mentioning that this same effect occurs when aggregating one-sided zero-infinity distributions such as exponential random variables. When accumulated they become Gamma distributions, which can look a lot like Gaussian or bell-shaped distributions, but they are skewed/asymmetrical. $\endgroup$ Commented Jan 3, 2020 at 21:18
18
$\begingroup$

‘Bell curve’ often refers to a Gaussian distribution. That distribution is so common that it’s also called the normal distribution. It’s very common because it emerges any time you’re looking at the sum of many things from a single distribution: I.e. lots of tiny fluctuations which, under the Central Limit Theorem, add up to a Gaussian distribution.

Although they look bell-shaped, none of the examples here are actually Gaussian, however. They have somewhat more complicated causes.

Of the three, the Maxwell distribution comes closest. It’s a little higher in the upper tail than a Gaussian, and goes to zero at zero unlike a Gaussian. (The distribution of velocities along a single axis is Gaussian) Physically, this is caused by phase space: to have speed exactly zero, a particle needs all of Vx, Vy and Vz zero, which is very unlikely.

The other two distributions are even further from Gaussian.

The Wien distributions do have a quantum-mechanical reason, though it’s somewhat specific to the underlying Planck radiation: it comes from the need for the higher energy (lower wavelength) radiation to come in specific-sized quanta. This causes the increase coming in from the left to have to turn over to reach zero at zero.

The Beta decay shape also doesn’t come from combining lots of small effects. Rather, it also comes from phase space: when the beta particle has a middling energy, there are lots of possibilities for the direction and energy of the nucleus and neutrino. At very high or very low energies, however, there are much fewer possibilities: everything has to line up just right, so the probability is lower.

Many physical distributions, particularly in thermal or stochastic physics, do have a “round central hump, declining on both sides” look due to the limits of the physically possible: some principle, like quantization or conservation of energy, makes it very unlikely or even impossible past some value. In thermal physics, this is often the laws of probability: you’re combining a bunch of little effects, it’s unlikely they’ll all go one way or the other. Having all the events push you out into one tail or the other is unlikely, and the further out you go, the less likely that lineup gets. So it’s common for a physical distribution to slope away from a central peak that’s roughly where all the +/- fluctuations have cancelled out.

$\endgroup$
6
  • 1
    $\begingroup$ OP isn't talking about Gaussian curves, they are talking about a curve that rises smoothly from 0 to some peak value before smoothly decreasing to zero again. $\endgroup$
    – Kyle Kanos
    Commented Dec 28, 2019 at 19:20
  • $\begingroup$ See last two paragraphs. $\endgroup$ Commented Dec 28, 2019 at 19:24
  • 2
    $\begingroup$ We differ, then. Such is life on SE. $\endgroup$ Commented Dec 28, 2019 at 19:26
  • 1
    $\begingroup$ You at least realize that "bell shape" does not strictly mean Gaussian, right? There's plenty of other options: en.wikipedia.org/wiki/Bell_shaped_function $\endgroup$
    – Kyle Kanos
    Commented Dec 28, 2019 at 19:32
  • 1
    $\begingroup$ Understood. See also lexico.com/definition/bell_curve is there a better way to phrase the first sentence? $\endgroup$ Commented Dec 28, 2019 at 19:37
9
$\begingroup$

Useful distributions in physics tend to have the following traits:

  • continuous/smooth function
  • asymptotic approach zero for large $x$ and either very small $x$ (i.e., 0) or negative infinity
  • have a single peak

which are pretty much the defining features of bell shaped functions:

A bell-shaped function or simply 'bell curve' is a mathematical function having a characteristic "bell"-shaped curve. These functions are typically continuous or smooth, asymptotically approach zero for large negative/positive $x$, and have a single, unimodal maximum at small $x$.


There are, of course, useful distributions in physics that do not follow all of these traits (and therefore are not bell-shaped). For instance power-law distributions (used in stellar initial mass function and cosmic ray fluxes), this type of distribution still is continuous and single-peaked, but does not asymptotically approach 0 at either end. In this case, when one needs to integrate over the distribution, one would use the physical bounds for the upper and lower limits (e.g., 0.08$M_\odot$ and ~150$M_\odot$ for the initial mass function, cf. this SE post of mine), rather than $(0,\,+\infty)$ or $(-\infty,\,+\infty)$

$\endgroup$
0
2
$\begingroup$

As far as I can tell, if you want them to be continuous, start at the origin, be non-negative and have a definite improper integral, they will need to tend to $0$ at $+ \infty$, be bounded and accept a maximum.

On top of that, if they accept exactly one local maximum, they will have a similar shape to the curves you posted.

$\endgroup$
2
  • $\begingroup$ This is pretty much exactly what I wrote, except that the lower bound can be $-\infty$ & not just 0, see the Gaussian curve, for instance. $\endgroup$
    – Kyle Kanos
    Commented Dec 29, 2019 at 12:09
  • 2
    $\begingroup$ @KyleKanos: Fair enough. Please modify or remove the wrong assertion in your answer and I'll remove my answer. $\endgroup$ Commented Dec 29, 2019 at 12:18

Your Answer

By clicking “Post Your Answer”, you agree to our terms of service and acknowledge you have read our privacy policy.

Not the answer you're looking for? Browse other questions tagged or ask your own question.