1
$\begingroup$

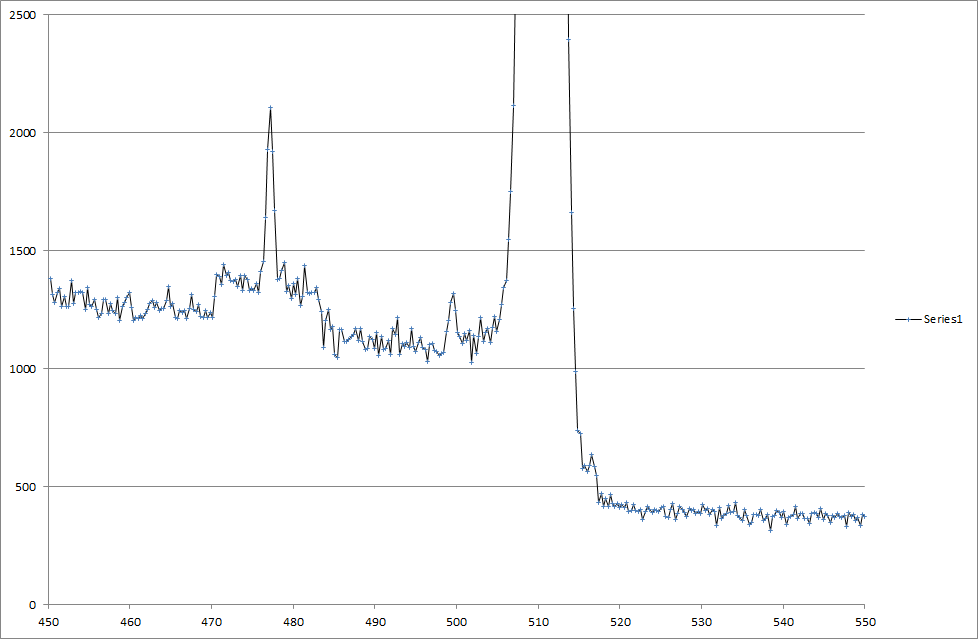
What is this strange structure in the gamma spectrum between 450 and 550 keV (below) around the peak at 477 keV? The spectrum seems to rise to a plateau (almost like a small Compton plateau) around the line and then go back down. What could be causing this?

For anyone curious, the huge line next door is the Annihilation line.

477 keV gamma line

P.s. I haven't actually identified the small line at 499 keV on this diagram either. If anyone knows about that one it'd be similarly be appreciated!

$\endgroup$
6
  • 1
    $\begingroup$ The energy of about 470–480 keV compared to the annihilation peak at 511 keV does not fit to a Compton edge or a backscatter peak. This could be X-ray escape peaks corresponding to the annihilation peak (it might as well be a problem with the voltage source or amplifier or even due to the electromagnetic compatibility with other equipment in the lab). What is the geometry of the sample and the detector? Do you see any other peaks in the entire spectrum? What is the peak at 477 keV? Be-7? $\endgroup$
    – user59991
    Commented Sep 10, 2015 at 12:12
  • $\begingroup$ I don't understand what you mean by X-ray escape peaks corresponding to the annihilation peak - could you elaborate? I find it unlikely that it's a problem with the equipment as this is a sample spectrum, already analysed that I've been given to learn with. I don't know what the geometry of the sample and detector was. It's possible that the detector was simply placed in the hall whilst a neutron spallation source was active in order to observe the environment. The peak at 477 seems to be Be-7. There are many other peaks on the spectrum; about 50 total. $\endgroup$
    – Matt
    Commented Sep 10, 2015 at 12:25
  • 3
    $\begingroup$ In the absorption process of the gamma-ray, a characteristic X-ray of a few tens of keV or less may be emitted by the absorber atom. If the absorption occurs near the surface of the detector, the X-ray may escape. Thus, the energy deposited in the detector is decreased by an amount equal to the X-ray energy. Therefore, an X-ray escape peak appears in the spectrum at a distance equal to the energy of the characteristic X-ray below the full-energy peak. Since the annihilation peak is relatively broad, the corresponding X-ray escape peaks might cover a similar energy range. $\endgroup$
    – user59991
    Commented Sep 10, 2015 at 12:59
  • 1
    $\begingroup$ Just because someone gives you a spectrum doesn't mean that there is no problem with the equipment and/or the setup. In a case like this you need to have a spectrum taken with the same instrument at the same settings but without the main radiation source. I think Loong's explanation is a good one, but it needs to be tested using the equipment and controls. $\endgroup$
    – CuriousOne
    Commented Sep 10, 2015 at 14:46
  • 1
    $\begingroup$ To emphasize @CuriousOne's point I might very well intentionally give someone a spectrum I knew to be bad to learn on. Noticing problems in data, investigating them, and running down the cause is a big part of an experimental scientist's skill set. $\endgroup$ Commented Sep 10, 2015 at 18:51

1 Answer 1

0
$\begingroup$

It turns out that this structure is the a doppler broadened line coming from the $^{10}$B(n,$\alpha$) reaction which populates the 477.6 keV excited state in $^7$Li.

$\endgroup$

Your Answer

By clicking “Post Your Answer”, you agree to our terms of service and acknowledge you have read our privacy policy.

Not the answer you're looking for? Browse other questions tagged or ask your own question.