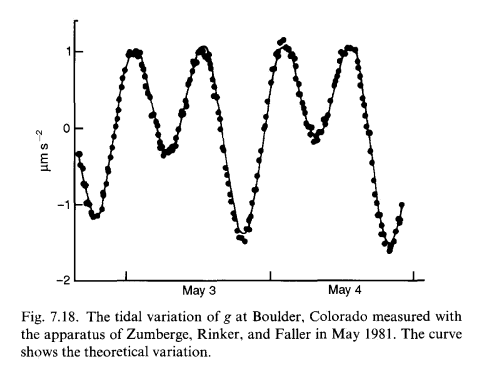
I believe the explanation can be found in Manual of Harmonic Analysis and Prediction of Tides :
In deriving mathematical expressions for the tide-producing forces of
the moon and sun, the principal factors to be taken into consideration
are the rotation of the earth, the revolution of the moon around the
earth, the revolution of the earth around the sun, the inclination of
the moon's orbit to the earth's equator, and the obliquity of the
ecliptic.
The key here is the fact that the earth's axis is at an angle relative to the plane of the sun, and that in general the moon will not be in the same plane. Thus, there are two sets of bulges - but they will be not be symmetrical with respect to the equator. What you are seeing then is the fact that a typical point on earth (away from the equator) will be closer to one bulge than the other...

In this picture you can see that for a given latitude away from the equator, you will "see" more of one bulge of the tides than the other. This asymmetry is present for both the lunar and the solar tides (although to different degree, given that the moon's orbit is tilted differently). The result is a 24 hour component.
This is described very well at http://oceanmotion.org/html/background/tides-types.htm - confirming that the tides become more symmetrical when the moon is over the equator, and less so when it moves towards the tropics of Cancer or Capricorn.
Quoting from that reference:
Different types of tides occur when the moon is either north or south of the equator. Whereas semidiurnal tides are observed at the equator at all times, most locations north or south of the equator experience two unequal high tides and two unequal low tides per tidal day; this is called a mixed tide and the difference in height between successive high (or low) tides is called the diurnal inequality. When the moon is above the Tropic of Cancer or Tropic of Capricorn, the diurnal inequality is at its maximum and the tides are called tropic tides. When the moon is above or nearly above the equator, the diurnal inequality is minimum and the tides are known as equatorial tides. When the moon and its associated tidal bulges are either north or south of the equator, most points at high latitudes in theory would be impacted by one tidal bulge and would experience one high tide and one low tide per tidal day. This so-called diurnal tide has a period of 24 hrs and 50 min.
If you are interested in the math, you might want to spend the time decoding this program which implements the equations and shows good agreement with observations.
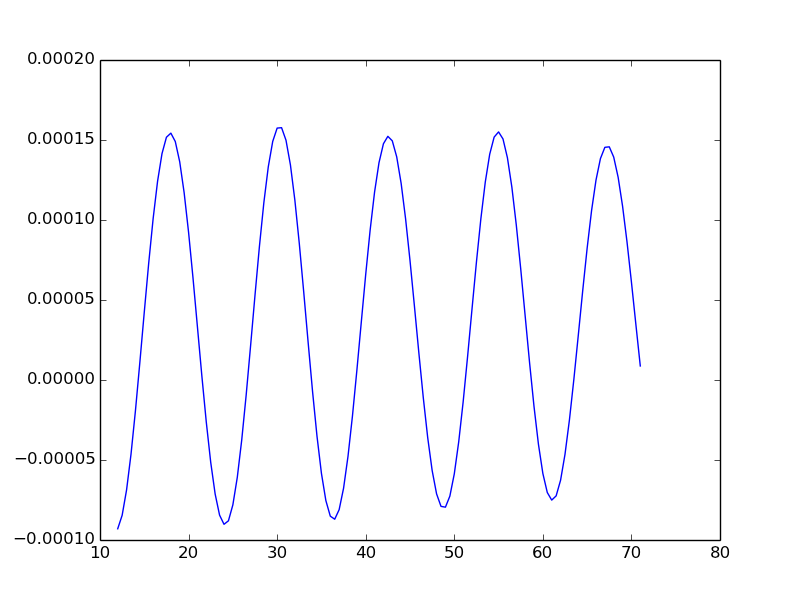
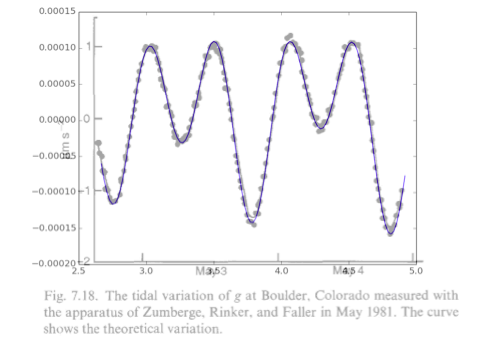
EDIT I got curious and converted the code at the link above to Python (so I could run it). Then I ran it for three different cases. The Y axis is in microgals ($1\ gal = 1\ cm/s^{2}$ - the galileo is the common unit in this field). The units on the X axis are hours - but the date is wrong (I had some trouble initially adapting the code properly - I believe these plots might correspond to January 1981, but I am not certain. The effect, however, is real.)
Latitude = 0:
Latitude = 20:
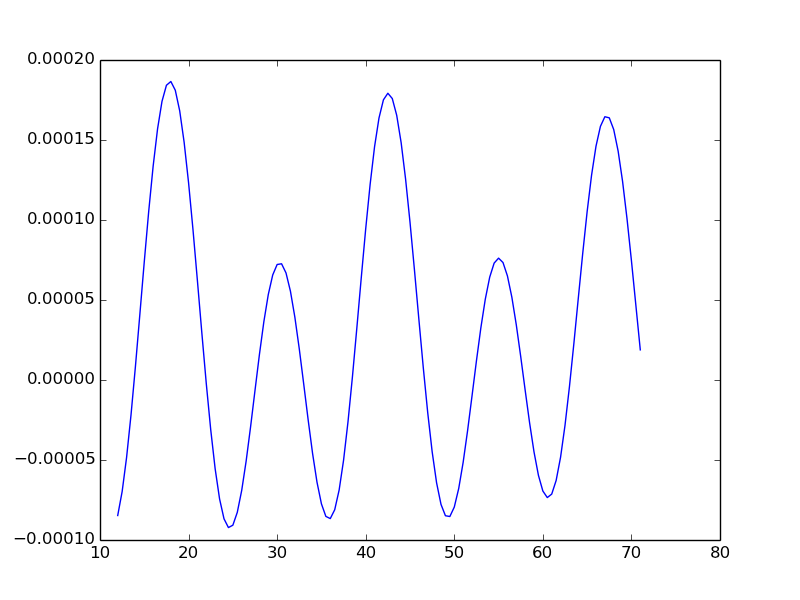
Latitude = 40:
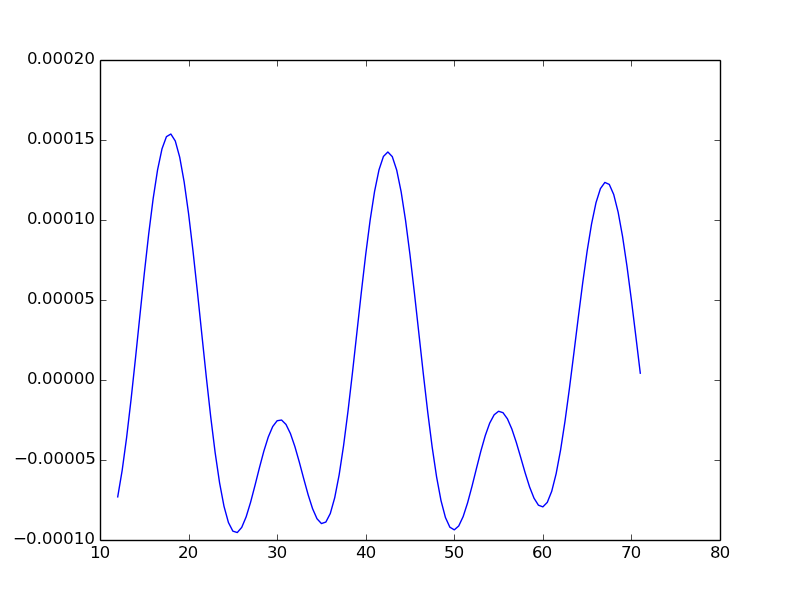
It is pretty obvious that the asymmetry between the tides is a function of the latitude, just at my picture above would predict, and although there are clear discrepancies between this plot and the one in the original paper, the general shape and magnitude is the same - especially for latitude 40 (Boulder is at 40 degrees latitude). I think we have found the culprit.
POSTSCRIPT
I had some problems getting the output from my program to match the figure; but I figured it out. Here is the overlay of the data with the output of the program for May 2/3/5 1981 for latitude 40, longitude 105:
And here is the Python code (note - I took the BASIC code and adapted it as little as possible... this is not being offered for code review, just for reference!)
"""
From the original:

'  TIDE-ACD.BAS
'
'       Copyright, 1993, J. L. Ahern
'
'  Calculates the acceleration due to the sun and moon at a given location,
'    for every hour, beginning at a specified hour, day, month and year.
'    Value calculated is the UPWARD pull due to the sun and moon. To use
'    as correction to measured gravity data, you would need to ADD these
'    numbers, not subtract them.  When the moon is overhead, for example
'    this program predicts a relatively large positive number, indicating
'    a large upward pull due to the moon. This would result in a DECREASE
'    in a gravity meter reading. Thus the tide value would be ADDED to
'    correct for this effect.
'
'    Based on equations presented by
'
'       Schureman, P., A manual of the harmonic analysis and prediction of
'         tides. U.S. Coast and Geodetic Survey, Spec. Pub. 98, 1924 (revised
'         in 1941 and 1958).
'
'  and collected by
'
'       Longman, I. M., Formulas for computing the tidal acceleration due to
'         the moon and the sun. J. Geophys. Res., 64, 2351-2355, 1959.
'
'  Love numbers from Stacey, Physics of the Earth.
'
'  Algorithm for computing days since 1900 seems to be correct (except for
'    for first 3 months of 1900); Excel calls Jan. 1, 1900 day 1 (not day
'    0) and then mistakenly includes a leap day in 1900, even though 1900
'    is not divisible by 400. Quattro correctly skips the leap year in
'    1900, but calls Jan. 1, 1900 day 2, apparently so it gives the same
'    results as Excel (and probably, Lotus 123)

This version adapted to Python by Floris for physics.stackexchange.com
- for illustration of the tides calculation only
Please do not rely on this code unless you check it carefully against the
original source:

    http://gravmag.ou.edu/reduce/tide-acd.txt

"""
from math import sin,cos,asin,acos,atan, floor, sqrt
from numpy import arange, zeros
from datetime import date
import matplotlib.pyplot as plt

#Boulder:

lng=105
lamda = 40 # latitude
h = 160000  # elevation, cm; tides are VERY insensitive to elevation changes

plt.close()

#constants
pi = 3.1415927#
mu = 6.67E-08
m = 7.3537E+25
s = 1.993E+33
il = .08979719#
omega = .4093146162#
ml = .074804
el = .0549
cl1 = 1.495E+13
cl = 3.84402E+10
al = 6.37827E+08
# Love Numbers
h2 = .59
k2 = .27
LoveFactor = (1 + h2 - 1.5 * k2) #' w/h2=0.59 & k2=0.27, LoveFactor=1.185

# starting day of the month:
minc=[ 0,31,59,90,120,151,181,212,243,273,304,334]

g0max = 0
g0min = 0


minit = 0
timezone = 0 # offset in time vs gmt
hour = 16    # start at 4 pm in local time
day = 2      # May 2, 1981
month = 5
year = 1981
nhours = 55
hrinc = 0.5
xb = hour + timezone
xe = xb + nhours
# algorithm doesn't work for the first two months of 1900
ii=0
nn = nhours / hrinc
xx=zeros(nn)
yy=zeros(nn)
for hrgmt in arange(xb, xe, hrinc):
        dday = day + hrgmt / 24
        tl0 = hrgmt + minit / 60
        nleap = int((year - 1900) / 4)
        if (year % 4 == 0 and month < 3):
            nleap = nleap - 1

        xm = minc[month-1]
        tdays = .5 + (year - 1900) * 365 + nleap + xm + (day - 1) + tl0 / 24

        t = tdays / 36525
        n = 4.523601612 - 33.75715303 * t + .0000367488 * t * t + .0000000387 * t * t * t
        el1 = .01675104 - .0000418 * t + .000000126 * t * t
        sl = 4.720023438 + 8399.7093 * t + .0000440695 * t * t + .0000000329 * t * t * t
        pl = 5.835124721 + 71.01800935999999 * t - .0001805446 * t * t - .0000002181 * t * t * t
        hl = 4.881627934 + 628.3319508 * t + .0000052796 * t * t
        pl1 = 4.908229467 + .0300052641 * t + 7.902400000000001E-06 * t * t + .0000000581 * t * t * t
        i = acos(.9136975738000001 - .0356895353 * cos(n))
        nu = asin(.0896765581 * sin(n) / sin(i))
        L = lng * .0174532925
        tl = (15 * (tl0 - 12) - lng) * .0174532925  # magic number converts degrees to radians: 2 pi / 360
        chi = tl + hl - nu
        chi1 = tl + hl
        ll1 = hl + 2 * el1 * sin(hl - pl1)
        cosalf = cos(n) * cos(nu) + sin(n) * sin(nu) * .9173938078
        sinalf = .3979806546 * sin(n) / sin(i)
        alf = 2 * atan(sinalf / (1 + cosalf))
        xi = n - alf
        sigma = sl - xi
        ll = sigma + .1098 * sin(sl - pl) + .0037675125 * sin(2 * (sl - pl)) + .0154002735 * sin(sl - 2 * hl + pl) + .0076940028 * sin(2 * (sl - hl))
        lm = lamda * .0174532925
        costht = sin(lm) * sin(i) * sin(ll) + cos(lm) * (((cos(.5 * i)) ** 2) * cos(ll - chi) + ((sin(.5 * i)) ** 2) * cos(ll + chi))
        cosphi = sin(lm) * .3979806546 * sin(ll1) + cos(lm) * (.9586969039 * cos(ll1 - chi1) + .0413030961 * cos(ll1 + chi1))
        c = 1 / sqrt(1 + .006738 * (sin(lm) ** 2))
        rl = 6.37827E+08 * c + h
        ap = 2.60930776E-11
        ap1 = 1 / (1.495E+13 * (1 - el1 * el1))
        dl = 1 / (1 / cl + ap * el * cos(sl - pl) + ap * el * el * cos(2 * (sl - pl)) + 1.875 * ap * ml * el * cos(sl - 2 * hl + pl) + ap * ml * ml * cos(2 * (sl - hl)))
        D = 1 / (1 / cl1 + ap1 * el1 * cos(hl - pl1))
        gm = mu * m * rl * (3 * (costht ** 2) - 1) / (dl * dl * dl) + 1.5 * mu * m * rl * rl * (5 * (costht ** 3) - 3 * costht) / (dl ** 4)
        gs = mu * s * rl * (3 * (cosphi ** 2) - 1) / (D * D * D)
        g0 = (gm + gs) * LoveFactor

        xx[ii]=day+(hrgmt-timezone)/24 # back to local time - in days
        yy[ii]=-g0 # flip the sign to match diagram
        ii=ii+1

plt.plot(xx[0:ii-1],yy[0:ii-1])
plt.show()
