2
$\begingroup$

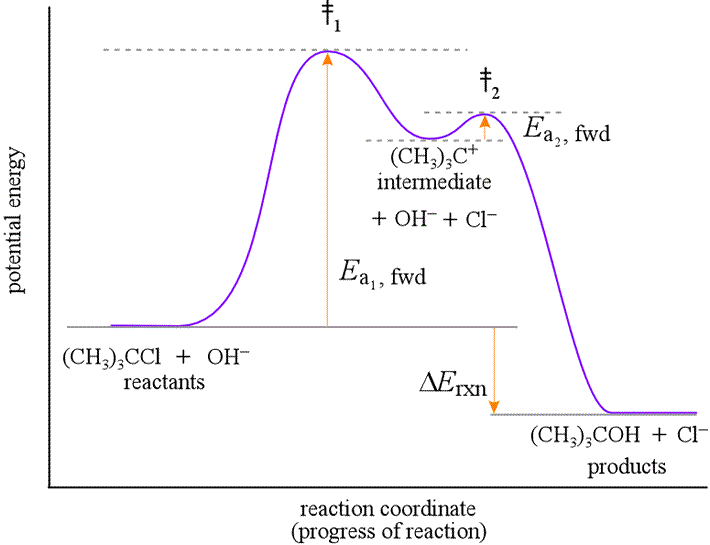
In chemical reactions one often considers so called "reaction coordinate" diagrams like this:

enter image description here

Is it possible to interpret the abstract "reaction coordinate" just as a simple time axis?

If so, are there any examples from simulations and measurements with quantitative (and not only qualitative) versions of such a diagram. I guess that the time scale should be about some femtoseconds, but I am not sure.

I already searched the web for this question but did only find an educational paper, where this is identified as a misconception

Additionally, being explicit that the energy diagram is a two dimensional depiction of the energy of the molecules as a function of the structure (Anslyn and Dougherty, 2006) and not time could possibly aid in conceptual conflict and encouragement of new schemata and possibly in conceptual change.

But I didn't find any further explanation why a parametrization by time is ruled out (also taking the quoted reference into account didn't help).

Edit

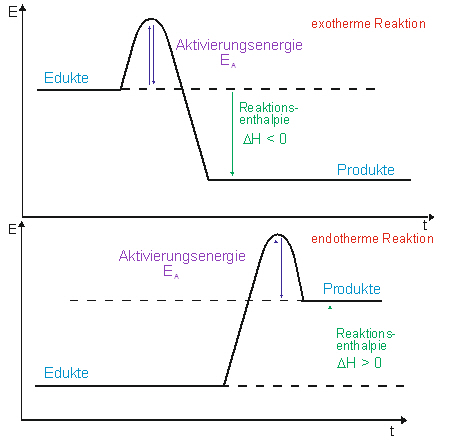
I have found several times a representation using time as axis in high school level representations. For example from this page from the ministry of education in Baden Württemberg (Germany):

enter image description here

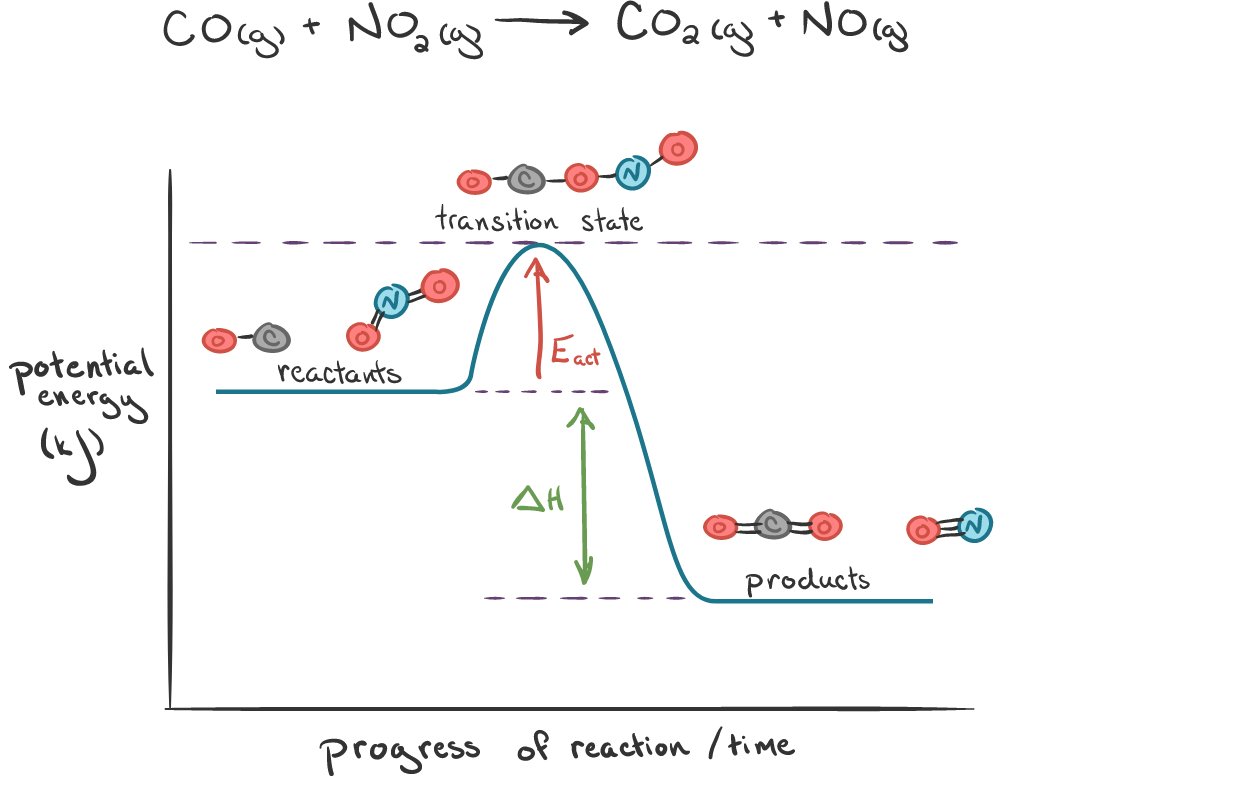
or from khanacademy:

enter image description here

Other examples are here, here (page 3, german "Reaktionszeit" means "reaction time")

$\endgroup$
3
  • $\begingroup$ As some answers below explain, there's no a priori relation between time and a reaction coordinate (just like there isn't one between time and a usual position coordinate). If you can, I recommend grabbing a copy of Astarita's Thermodynamics: An Advanced Textbook for Chemical Engineers (Springer 1998). It's simply great in explaining all these concepts. $\endgroup$
    – pglpm
    Commented Dec 10, 2020 at 17:55
  • $\begingroup$ So as an analogy: If you consider a mechanical spring, you have a linear $F(x)$ Diagram (force in dependence of the position). In this analogy $F$ corresponds to the potential Energy and $x$ to the reaction coordinate. Now if you consider $x$ in dependence of the time (determined by the dynamics), you get a sinusoidal solution and the graph of $F(x(t))$ would also look sinusoidal and not linear anymore. So transferring the analogy back, one may say that indeed you may parametrize the reaction coordinate by time, but the diagram my look much different than the examples above? $\endgroup$
    – dp21
    Commented Dec 10, 2020 at 22:34
  • $\begingroup$ However it may look different, but it is also conceivable that it looks qualitatively similar. If the latter one would be the case then the answer to my question would be yes, that one could interpret the axis to the right as time axis in a qualitative representation and the pictures cited in my edit are notwrong, just a reasonable and justified simplification (e.g. for high school students). $\endgroup$
    – dp21
    Commented Dec 10, 2020 at 22:36

2 Answers 2

1
$\begingroup$

But I didn't find any further explanation why a parametrization by time is ruled out

You won't find that 'further explanation' simply because these energy diagrams are really not about time and few would see it that way.

The diagrams are clear and stylish representations of the energy levels of the various constituents of a given reaction. It reads easier to do this in $\text{2D}$ but that doesn't imply the horizontal axis is a time axis.

Edit

I have found several times a representation using time as axis in high school level representations. For example from this page from the ministry of education in Baden Württemberg (Germany)

Sadly, state education (high school) texts are the worst to use as 'adjudicators' here. High school text books are riddled with errors, distortions and misquotes.

Same with 'kahnacademy': a populist educational site, with only one purpose in life; to make money and lots of it too.

$\endgroup$
5
  • $\begingroup$ Even further, those diagrams relate to the thermodynamics (or statistical mechanics) of the reaction pathway, but kinetics of the reaction is an entirely separate issue. $\endgroup$
    – Jon Custer
    Commented Dec 9, 2020 at 22:41
  • $\begingroup$ Thanks for further clarifying. $\endgroup$
    – Gert
    Commented Dec 9, 2020 at 22:49
  • $\begingroup$ How would you describe what "reaction coordinate" means exactly? How to measure it? In the diagram of my post the axis to the right is also labeled "progress of the reaction". But how can I measure a progress if not by time? $\endgroup$
    – dp21
    Commented Dec 10, 2020 at 7:09
  • $\begingroup$ "How would you describe what "reaction coordinate" means exactly? How to measure it?" I don't know. It's a nebulous term and it's the first time I've encountered it. Same with "progress of the reaction": it is not quantified here. As @Jon Custer said, in Chemistry we have a principle: $\text{thermodynamics} \neq \text{kinetics}$. The diagram represents thermodynamics, which is distinct of and independent from kinetics. $\endgroup$
    – Gert
    Commented Dec 10, 2020 at 13:20
  • $\begingroup$ There is a precise definition called "intrinsic reaction coordinate", which can be calculated using quantum chemistry onlinelibrary.wiley.com/doi/full/10.1002/qua.24757 $\endgroup$ Commented Dec 10, 2020 at 13:40
0
$\begingroup$

Typically studying the progress(yield/conversion) as a function of time is a field known as chemical kinetics where there are basic differential equations of concentration with rrespect to time being equal to a constant multiplied by the concentrations either multiplied together or raised to a power based upon the collision theory mechanism of the reaction. $$ \frac{d[concentration Product]}{dt}=K[Concentration Reactant1]^x[Concentration Reactant 2]^y$$ The constant multiplying these concentrations is known as the reaction rate constant K (not to be confused with the equilibrium constant which is to do with chemical equilibrium & thermodynamics). It is actually often confused with this, at equilibrium there isnt even any observable reaction anyway as both the forward and reverse rates are equal. The reaction rate constant is a function of temperature.

Moreover the Gibbs free energy is related directly to the your figures as well $$ \Delta G= \mu dN + VdP + SdT$$ where $$ \mu $$ is a function of both T and P and can infact even be a function of magnetic fields and electric fields. So chemical reactions can be reversed in multiple ways including pressure, temperature, electrolysis and even maybe even magnetism? what are some other ways to do this?

$\endgroup$

Your Answer

By clicking “Post Your Answer”, you agree to our terms of service and acknowledge you have read our privacy policy.

Not the answer you're looking for? Browse other questions tagged or ask your own question.