Added explanation
Source Link
Thomas
  • 2.8k
  • 15
  • 10

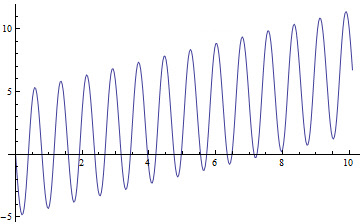
You are essentially correct to assume that the precession is sometimes backwards as well. The frequently quoted value of 531"/cy is only the long term net average. In reality there is a considerable oscillatory component added to this, as illustrated in the following schematic figure

precession of perihelion

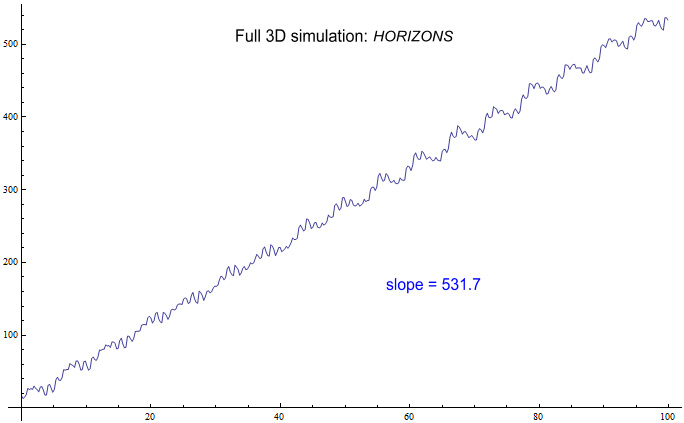
The oscillation period here is essentially the orbital period of the disturbing planet. The effect is exaggerated here just to demonstrate it. If you do the same calculation with the actual data for all planets, you get the following graph for Mercury's Newtonian perihelion precession

Mercury Perihelion precession

Although the increase of the perihelion angle is now closer to a linear increase, there is still a considerable wobble, and at times it is going backwards for a few years. The two main periods in the oscillation visible here are those of Jupiter and Venus, which have the largest impact on the precession (Jupiter due to its mass and Venus due to its proximity)

For more details see the web page Mercury's Perihelion Advance from which also the above figures were taken


EDIT: Let me add a qualitative explanation of what is happening here:

an outer planet in opposition to Mercury (i.e. on the same side of the Sun) will result in a small force pulling it away from the Sun. So if Mercury is moving away from the Sun again after its closest approach (perihelion) the gravitational force of the Sun will effectively be reduced slightly and it takes longer to bring the radial velocity back to zero again. This means Mercury will go slightly further in its orbit until it has reached its furthest point (aphelion) i.e. a positive precession. If however the disturbing planet is on the opposite side of the Sun, its gravitational field will effectively increase the gravitational field of the Sun, so the effect will be the other way around, leading to a negative (backwards) precession. In the latter case the planet is further away though than in opposition, so the effect is smaller, leaving an overall positive (forward) precession on average. The net result can therefore be seen as an oscillatory precession angle (related to the time dependent orbital motion of the disturbing planet) superposed on a linearly increasing precession angle related to the time averaged mass distribution of the planet (which is effectively a circle/ellipse and thus always produces an outward directed force i.e. a positive precession)

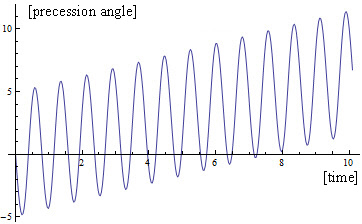
You are essentially correct to assume that the precession is sometimes backwards as well. The frequently quoted value of 531"/cy is only the long term net average. In reality there is a considerable oscillatory component added to this, as illustrated in the following schematic figure

precession of perihelion

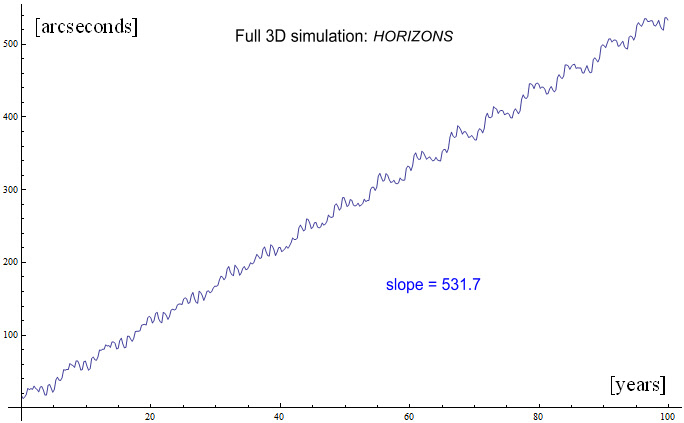
The oscillation period here is essentially the orbital period of the disturbing planet. The effect is exaggerated here just to demonstrate it. If you do the same calculation with the actual data for all planets, you get the following graph for Mercury's Newtonian perihelion precession

Mercury Perihelion precession

Although the increase of the perihelion angle is now closer to a linear increase, there is still a considerable wobble, and at times it is going backwards for a few years. The two main periods in the oscillation visible here are those of Jupiter and Venus, which have the largest impact on the precession (Jupiter due to its mass and Venus due to its proximity)

For more details see the web page Mercury's Perihelion Advance from which also the above figures were taken


EDIT: Let me add a qualitative explanation of what is happening here:

an outer planet in opposition to Mercury (i.e. on the same side of the Sun) will result in a small force pulling it away from the Sun. So if Mercury is moving away from the Sun again after its closest approach (perihelion) the gravitational force of the Sun will effectively be reduced slightly and it takes longer to bring the radial velocity back to zero again. This means Mercury will go slightly further in its orbit until it has reached its furthest point (aphelion) i.e. a positive precession. If however the disturbing planet is on the opposite side of the Sun, its gravitational field will effectively increase the gravitational field of the Sun, so the effect will be the other way around, leading to a negative (backwards) precession. In the latter case the planet is further away though than in opposition, so the effect is smaller, leaving an overall positive (forward) precession on average. The net result can therefore be seen as an oscillatory precession angle (related to the time dependent orbital motion of the disturbing planet) superposed on a linearly increasing precession angle related to the time averaged mass distribution of the planet (which is effectively a circle/ellipse and thus always produces an outward directed force i.e. a positive precession)
Added units to graphs
Source Link
Thomas
  • 2.8k
  • 15
  • 10

You are essentially correct to assume that the precession is sometimes backwards as well. The frequently quoted value of 531"/cy is only the long term net average. In reality there is a considerable oscillatory component added to this, as illustrated in the following schematic figure

precession of perihelionprecession of perihelion

The oscillation period here is essentially the orbital period of the disturbing planet. The effect is exaggerated here just to demonstrate it. If you do the same calculation with the actual data for all planets, you get the following graph for Mercury's Newtonian perihelion precession

Mercury Perihelion precession

Although the increase of the perihelion angle is now closer to a linear increase, there is still a considerable wobble, and at times it is going backwards for a few years. The two main periods in the oscillation visible here are those of Jupiter and Venus, which have the largest impact on the precession (Jupiter due to its mass and Venus due to its proximity)

For more details see the web page Mercury's Perihelion Advance from which also the above figures were taken

You are essentially correct to assume that the precession is sometimes backwards as well. The frequently quoted value of 531"/cy is only the long term net average. In reality there is a considerable oscillatory component added to this, as illustrated in the following schematic figure

precession of perihelion

The oscillation period here is essentially the orbital period of the disturbing planet. The effect is exaggerated here just to demonstrate it. If you do the same calculation with the actual data for all planets, you get the following graph for Mercury's Newtonian perihelion precession

Mercury Perihelion precession

Although the increase of the perihelion angle is now closer to a linear increase, there is still a considerable wobble, and at times it is going backwards for a few years. The two main periods in the oscillation visible here are those of Jupiter and Venus, which have the largest impact on the precession (Jupiter due to its mass and Venus due to its proximity)

For more details see the web page Mercury's Perihelion Advance from which also the above figures were taken

Added units to graph
Source Link
Thomas
  • 2.8k
  • 15
  • 10

You are essentially correct to assume that the precession is sometimes backwards as well. The frequently quoted value of 531"/cy is only the long term net average. In reality there is a considerable oscillatory component added to this, as illustrated in the following schematic figure

precession of perihelion

The oscillation period here is essentially the orbital period of the disturbing planet. The effect is exaggerated here just to demonstrate it. If you do the same calculation with the actual data for all planets, you get the following graph for Mercury's Newtonian perihelion precession

Mercuys perihelion precessionMercury Perihelion precession

Although the increase of the perihelion angle is now closer to a linear increase, there is still a considerable wobble, and at times it is going backwards for a few years. The two main periods in the oscillation visible here are those of Jupiter and Venus, which have the largest impact on the precession (Jupiter due to its mass and Venus due to its proximity)

For more details see the web page Mercury's Perihelion Advance from which also the above figures were taken

You are essentially correct to assume that the precession is sometimes backwards as well. The frequently quoted value of 531"/cy is only the long term net average. In reality there is a considerable oscillatory component added to this, as illustrated in the following schematic figure

precession of perihelion

The oscillation period here is essentially the orbital period of the disturbing planet. The effect is exaggerated here just to demonstrate it. If you do the same calculation with the actual data for all planets, you get the following graph for Mercury's Newtonian perihelion precession

Mercuys perihelion precession

Although the increase of the perihelion angle is now closer to a linear increase, there is still a considerable wobble, and at times it is going backwards for a few years. The two main periods in the oscillation visible here are those of Jupiter and Venus, which have the largest impact on the precession (Jupiter due to its mass and Venus due to its proximity)

For more details see the web page Mercury's Perihelion Advance from which also the above figures were taken

You are essentially correct to assume that the precession is sometimes backwards as well. The frequently quoted value of 531"/cy is only the long term net average. In reality there is a considerable oscillatory component added to this, as illustrated in the following schematic figure

precession of perihelion

The oscillation period here is essentially the orbital period of the disturbing planet. The effect is exaggerated here just to demonstrate it. If you do the same calculation with the actual data for all planets, you get the following graph for Mercury's Newtonian perihelion precession

Mercury Perihelion precession

Although the increase of the perihelion angle is now closer to a linear increase, there is still a considerable wobble, and at times it is going backwards for a few years. The two main periods in the oscillation visible here are those of Jupiter and Venus, which have the largest impact on the precession (Jupiter due to its mass and Venus due to its proximity)

For more details see the web page Mercury's Perihelion Advance from which also the above figures were taken

Source Link
Thomas
  • 2.8k
  • 15
  • 10
Loading