replaced http://www.st-andrews.ac.uk/ with https://www.st-andrews.ac.uk/
Source Link

If the type of modulation you are talking about is FM, then the spectral content depends on its modulation index (M or $\beta$). The full equation for the output is (for a sinusoidal input only):

FM modulation with tones http://www.st-andrews.ac.uk/%7Ewww_pa/Scots_Guide/RadCom/part12/Images/page1/Eqn31.gifFM modulation with tones

The term inside the cosine is not easy to isolate.

With some algebra it can be separated out using bessel functions:

enter image description here enter image description here enter image description here

So you can see that this signal has frequency components at $f_c + n*f_m$. Where n is $-\infty$ to $+\infty$. Shocking isn't it? The Bessel Function $J_n\{\beta\}$ tends to approach zero at large values of n, but it is counter-intuitive to see all this frequency content.

So a simple sine wave modulation at frequency Fm can produce a variety of spectra depending on its modulation index (M or $\beta$) which is a ratio of the change in frequency deviation ($\Delta$f) to the maximum frequency of the modulated signal ($f_{m(max)}$). See the plots for different values of M for the same modulating tone at frequency $f_m$ where $M=\frac{\Delta f}{f_m}$

FM spectra

In reality, Carson's Rule is applied to limit the spectral content to about 98% of all the energy. This bandwidth is double the frequency deviation plus the maximum frequency of the input modulation content.

equation

So to answer your question the spectral content is not necessarily directly related to the modulated signal spectra with FM. It's periodic, sure, but there is a lot of content. If you knew the exact modulation parameters you could try to work backwards and estimate the modulated input based on relative amplitudes and spectral frequencies.

If the type of modulation you are talking about is FM, then the spectral content depends on its modulation index (M or $\beta$). The full equation for the output is (for a sinusoidal input only):

FM modulation with tones http://www.st-andrews.ac.uk/%7Ewww_pa/Scots_Guide/RadCom/part12/Images/page1/Eqn31.gif

The term inside the cosine is not easy to isolate.

With some algebra it can be separated out using bessel functions:

enter image description here enter image description here enter image description here

So you can see that this signal has frequency components at $f_c + n*f_m$. Where n is $-\infty$ to $+\infty$. Shocking isn't it? The Bessel Function $J_n\{\beta\}$ tends to approach zero at large values of n, but it is counter-intuitive to see all this frequency content.

So a simple sine wave modulation at frequency Fm can produce a variety of spectra depending on its modulation index (M or $\beta$) which is a ratio of the change in frequency deviation ($\Delta$f) to the maximum frequency of the modulated signal ($f_{m(max)}$). See the plots for different values of M for the same modulating tone at frequency $f_m$ where $M=\frac{\Delta f}{f_m}$

FM spectra

In reality, Carson's Rule is applied to limit the spectral content to about 98% of all the energy. This bandwidth is double the frequency deviation plus the maximum frequency of the input modulation content.

equation

So to answer your question the spectral content is not necessarily directly related to the modulated signal spectra with FM. It's periodic, sure, but there is a lot of content. If you knew the exact modulation parameters you could try to work backwards and estimate the modulated input based on relative amplitudes and spectral frequencies.

If the type of modulation you are talking about is FM, then the spectral content depends on its modulation index (M or $\beta$). The full equation for the output is (for a sinusoidal input only):

FM modulation with tones

The term inside the cosine is not easy to isolate.

With some algebra it can be separated out using bessel functions:

enter image description here enter image description here enter image description here

So you can see that this signal has frequency components at $f_c + n*f_m$. Where n is $-\infty$ to $+\infty$. Shocking isn't it? The Bessel Function $J_n\{\beta\}$ tends to approach zero at large values of n, but it is counter-intuitive to see all this frequency content.

So a simple sine wave modulation at frequency Fm can produce a variety of spectra depending on its modulation index (M or $\beta$) which is a ratio of the change in frequency deviation ($\Delta$f) to the maximum frequency of the modulated signal ($f_{m(max)}$). See the plots for different values of M for the same modulating tone at frequency $f_m$ where $M=\frac{\Delta f}{f_m}$
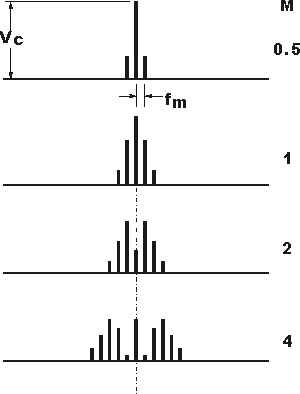
FM spectra

In reality, Carson's Rule is applied to limit the spectral content to about 98% of all the energy. This bandwidth is double the frequency deviation plus the maximum frequency of the input modulation content.

equation

So to answer your question the spectral content is not necessarily directly related to the modulated signal spectra with FM. It's periodic, sure, but there is a lot of content. If you knew the exact modulation parameters you could try to work backwards and estimate the modulated input based on relative amplitudes and spectral frequencies.

Added mathjax
Source Link
user6972
  • 5.8k
  • 22
  • 30

If the type of modulation you are talking about is FM, then the spectral content depends on its modulation index (BetaM or $\beta$). The full equation for the output is (for a sinusoidal input only):

FM modulation with tones http://www.st-andrews.ac.uk/%7Ewww_pa/Scots_Guide/RadCom/part12/Images/page1/Eqn31.gif

The term inside the cosine is not easy to isolate.

With some algebra it can be separated out using bessel functions:

enter image description here enter image description here enter image description here

So you can see that this signal has frequency components at Fc + n*Fm$f_c + n*f_m$. Where n is -infinity$-\infty$ to +infinity$+\infty$. Shocking isn't it? The Bessel Function Jn{Beta}$J_n\{\beta\}$ tends to approach zero at large values of n, but it is counter-intuitive to see all this frequency content.

So a simple sine wave modulation at frequency Fm can produce a variety of spectra depending on its modulation index (M or $\beta$) which is a ratio of the change in frequency deviation (delta f$\Delta$f) to the maximum frequency of the modulated signal (Fm_max$f_{m(max)}$). See the plots for different values of M for the same modulating tone at frequency Fm. $f_m$ where $M=\frac{\Delta f}{f_m}$

FM spectra

In reality, Carson's Rule is applied to limit the spectral content to about 98% of all the energy. This bandwidth is double the frequency deviation plus the maximum frequency of the input modulation content.

equation

So to answer your question the spectral content is not necessarily directly related to the modulated signal spectra with FM. It's periodic, sure, but there is a lot of content. If you knew the exact modulation parameters you could try to work backwards and estimate the modulated input based on relative amplitudes and spectral frequencies.

If the type of modulation you are talking about is FM, then the spectral content depends on its modulation index (Beta). The full equation for the output is (for a sinusoidal input only):

FM modulation with tones http://www.st-andrews.ac.uk/%7Ewww_pa/Scots_Guide/RadCom/part12/Images/page1/Eqn31.gif

The term inside the cosine is not easy to isolate.

With some algebra it can be separated out using bessel functions:

enter image description here enter image description here enter image description here

So you can see that this signal has frequency components at Fc + n*Fm. Where n is -infinity to +infinity. Shocking isn't it? The Bessel Function Jn{Beta} tends to approach zero at large values of n, but it is counter-intuitive to see all this frequency content.

So a simple sine wave modulation at frequency Fm can produce a variety of spectra depending on its modulation index (M) which is a ratio of the change in frequency deviation (delta f) to the maximum frequency of the modulated signal (Fm_max). See the plots for different values of M for the same modulating tone at frequency Fm. FM spectra

In reality, Carson's Rule is applied to limit the spectral content to about 98% of all the energy. This bandwidth is double the frequency deviation plus the maximum frequency of the input modulation content.

equation

So to answer your question the spectral content is not necessarily directly related to the modulated signal spectra with FM. It's periodic, sure, but there is a lot of content. If you knew the exact modulation parameters you could try to work backwards and estimate the modulated input based on relative amplitudes and spectral frequencies.

If the type of modulation you are talking about is FM, then the spectral content depends on its modulation index (M or $\beta$). The full equation for the output is (for a sinusoidal input only):

FM modulation with tones http://www.st-andrews.ac.uk/%7Ewww_pa/Scots_Guide/RadCom/part12/Images/page1/Eqn31.gif

The term inside the cosine is not easy to isolate.

With some algebra it can be separated out using bessel functions:

enter image description here enter image description here enter image description here

So you can see that this signal has frequency components at $f_c + n*f_m$. Where n is $-\infty$ to $+\infty$. Shocking isn't it? The Bessel Function $J_n\{\beta\}$ tends to approach zero at large values of n, but it is counter-intuitive to see all this frequency content.

So a simple sine wave modulation at frequency Fm can produce a variety of spectra depending on its modulation index (M or $\beta$) which is a ratio of the change in frequency deviation ($\Delta$f) to the maximum frequency of the modulated signal ($f_{m(max)}$). See the plots for different values of M for the same modulating tone at frequency $f_m$ where $M=\frac{\Delta f}{f_m}$

FM spectra

In reality, Carson's Rule is applied to limit the spectral content to about 98% of all the energy. This bandwidth is double the frequency deviation plus the maximum frequency of the input modulation content.

equation

So to answer your question the spectral content is not necessarily directly related to the modulated signal spectra with FM. It's periodic, sure, but there is a lot of content. If you knew the exact modulation parameters you could try to work backwards and estimate the modulated input based on relative amplitudes and spectral frequencies.

Added details of modulation index.
Source Link
user6972
  • 5.8k
  • 22
  • 30

If the type of modulation you are talking about is FM, then the spectral content depends on its modulation index (Beta). The full equation for the output is (for a sinusoidal input only):

FM modulation with tones http://www.st-andrews.ac.uk/%7Ewww_pa/Scots_Guide/RadCom/part12/Images/page1/Eqn31.gif

The term inside the cosine is not easy to isolate.

With some algebra it can be separated out using bessel functions:

enter image description here enter image description here enter image description here

So you can see that this signal has frequency components at Fc + n*Fm. Where n is -infinity to +infinity. Shocking isn't it? Shocking isn't it? The Bessel Function Jn{Beta} tends to approach zero at large values of n, but it is counter-intuitive to see all this frequency content.

So a simple sine wave modulation at frequency Fm can produce a variety of spectra depending on how itits modulation index (M) which is a ratio of the change in frequency deviation (delta f) to the maximum frequency of the modulated: signal (Fm_max). See the plots for different values of M for the same modulating tone at frequency Fm. FM spectra

In reality, Carson's Rule is applied to limit the spectral content to about 98% of all the energy. This bandwidth is double the frequency deviation plus the maximum frequency of the input modulation content.

equation

So to answer your question the spectral content is not necessarily directly related to the modulated signal spectra with FM. It's periodic, sure, but there is a lot of content. If you knew the exact modulation parameters you could try to work backwards and estimate the modulated input based on relative amplitudes and spectral frequencies.

If the type of modulation you are talking about is FM, then the spectral content depends on its modulation index (Beta). The full equation for the output is (for a sinusoidal input only):

FM modulation with tones http://www.st-andrews.ac.uk/%7Ewww_pa/Scots_Guide/RadCom/part12/Images/page1/Eqn31.gif

The term inside the cosine is not easy to isolate.

With some algebra it can be separated out using bessel functions:

enter image description here enter image description here enter image description here

So you can see that this signal has frequency components at Fc + n*Fm. Where n is -infinity to +infinity. Shocking isn't it? The Bessel Function Jn{Beta} tends to approach zero at large values of n, but it is counter-intuitive to see all this frequency content.

So a simple sine wave modulation can produce a variety of spectra depending on how it is modulated: FM spectra

In reality, Carson's Rule is applied to limit the spectral content to about 98% of all the energy. This bandwidth is double the frequency deviation plus the maximum frequency of the input modulation content.

equation

So to answer your question the spectral content is not necessarily directly related to the modulated signal spectra with FM. It's periodic, sure, but there is a lot of content. If you knew the exact modulation parameters you could try to work backwards and estimate the modulated input based on relative amplitudes and spectral frequencies.

If the type of modulation you are talking about is FM, then the spectral content depends on its modulation index (Beta). The full equation for the output is (for a sinusoidal input only):

FM modulation with tones http://www.st-andrews.ac.uk/%7Ewww_pa/Scots_Guide/RadCom/part12/Images/page1/Eqn31.gif

The term inside the cosine is not easy to isolate.

With some algebra it can be separated out using bessel functions:

enter image description here enter image description here enter image description here

So you can see that this signal has frequency components at Fc + n*Fm. Where n is -infinity to +infinity. Shocking isn't it? The Bessel Function Jn{Beta} tends to approach zero at large values of n, but it is counter-intuitive to see all this frequency content.

So a simple sine wave modulation at frequency Fm can produce a variety of spectra depending on its modulation index (M) which is a ratio of the change in frequency deviation (delta f) to the maximum frequency of the modulated signal (Fm_max). See the plots for different values of M for the same modulating tone at frequency Fm. FM spectra

In reality, Carson's Rule is applied to limit the spectral content to about 98% of all the energy. This bandwidth is double the frequency deviation plus the maximum frequency of the input modulation content.

equation

So to answer your question the spectral content is not necessarily directly related to the modulated signal spectra with FM. It's periodic, sure, but there is a lot of content. If you knew the exact modulation parameters you could try to work backwards and estimate the modulated input based on relative amplitudes and spectral frequencies.

added 30 characters in body
Source Link
user6972
  • 5.8k
  • 22
  • 30
Loading
added 344 characters in body
Source Link
user6972
  • 5.8k
  • 22
  • 30
Loading
Source Link
user6972
  • 5.8k
  • 22
  • 30
Loading