added 87 characters in body
Source Link
arivero
  • 1.9k
  • 18
  • 39

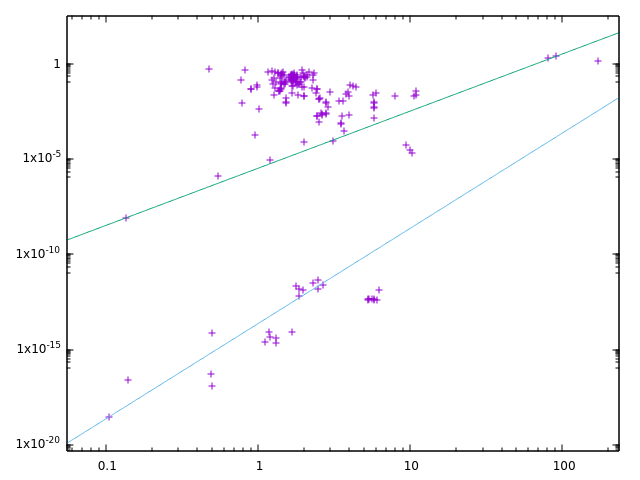
For beta decay of mesons, the heavy quark approximation and surely other techniques can be used to show that the decay width scales as the quintic power of mass. This can be checked from pdg files very easily with this gnuplot script:

  set logscale xy
  set key noautotitle
  plot "<cat Downloads/mass_width_2020.mcd|grep -v ^* | cut -c 32-" using "%20lf%*8lf%*8lf%16lf"
  replot 2.4952*(x/91.1876)**3
  replot 2.99591E-19*(x/0.105658)**5

The plot includes all the particles having mass and decay width listed in the particle data group datafile: mesons and baryons, some of their excited states, and also the Z0 and the W and the two unstable leptons, muon and tau. And the top quark. Higgs boson does not appear because its decay width is not yet in the table, proton does not appear because it is stable AFAWK, and well, the neutron does not appear because I have zoomed it out)

Units in the table are GeV (mass in the horizontal, decay width in the vertical). And you can appreciate the aforementioned quintic scaling as the blue line here.

a

But surprise, there is also an alignment for neutral, purely electromagnetic, decays. It is a cubic scaling. Is it an artifact, or can it be shown analytically?

To put more detail: the particles on the green line are $\pi^0, \eta, \Sigma^0, J/\Psi, \Psi(2S)$ and, rather peculiarly, the gauge bosons.

Particle Mass (Gev) Total Width (GeV) "Reduced Width" $MeV^{-2}$
$\pi^0$ 0.135 7.73E-9 3.1
$\eta$ 0.548 1.31E-6 8.0
$\Sigma$$\Sigma^0$ 1.19 8.90E-6 5.3
$D^*$ 2.01 8.34E-5 10.3
$J/\Psi$ 3.10 9.29E-5 3.1
$\Psi(2S)$ 3.69 2.94E-4 5.9
$B(s2)^*$ 5.84 1.49E-3 7.5
$Z^0$ 91.2 2.50 3.3

The particles above the green line are all the mesons and baryons that have strong decay. For some of these, when the partial EM decay width is known, usually to $\gamma\gamma$, it also aligns on the green line. I have checked this for $\omega, \phi$ and $\eta'$.

It would seem that the hadronic scale, extracted via the "reduced width" $\Gamma/M^3$, has some general bound, the only exception being the three first states in the bottom quark sector: $\Upsilon(1S,2S,3S)$ happen to have some extra of stability allowing them to lie under the cubic line. But note $\Upsilon(4S)$ is already above it.

For beta decay of mesons, the heavy quark approximation and surely other techniques can be used to show that the decay width scales as the quintic power of mass. This can be checked from pdg files very easily with this gnuplot script:

  set logscale xy
  set key noautotitle
  plot "<cat Downloads/mass_width_2020.mcd|grep -v ^* | cut -c 32-" using "%20lf%*8lf%*8lf%16lf"
  replot 2.4952*(x/91.1876)**3
  replot 2.99591E-19*(x/0.105658)**5

The plot includes all the particles having mass and decay width listed in the particle data group datafile: mesons and baryons, some of their excited states, and also the Z0 and the W and the two unstable leptons, muon and tau. And the top quark. Higgs boson does not appear because its decay width is not yet in the table, proton does not appear because it is stable AFAWK, and well, the neutron does not appear because I have zoomed it out)

Units in the table are GeV (mass in the horizontal, decay width in the vertical). And you can appreciate the aforementioned quintic scaling as the blue line here.

a

But surprise, there is also an alignment for neutral, purely electromagnetic, decays. It is a cubic scaling. Is it an artifact, or can it be shown analytically?

To put more detail: the particles on the green line are $\pi^0, \eta, \Sigma^0, J/\Psi, \Psi(2S)$ and, rather peculiarly, the gauge bosons.

Particle Mass (Gev) Total Width (GeV) "Reduced Width" $MeV^{-2}$
$\pi^0$ 0.135 7.73E-9 3.1
$\eta$ 8.0
$\Sigma$ 5.3
$D^*$ 10.3
$J/\Psi$ 3.1
$\Psi(2S)$ 5.9
$B(s2)^*$ 7.5
$Z^0$ 3.3

The particles above the green line are all the mesons and baryons that have strong decay. For some of these, when the partial EM decay width is known, usually to $\gamma\gamma$, it also aligns on the green line. I have checked this for $\omega, \phi$ and $\eta'$.

It would seem that the hadronic scale, extracted via the "reduced width" $\Gamma/M^3$, has some general bound, the only exception being the three first states in the bottom quark sector: $\Upsilon(1S,2S,3S)$ happen to have some extra of stability allowing them to lie under the cubic line. But note $\Upsilon(4S)$ is already above it.

For beta decay of mesons, the heavy quark approximation and surely other techniques can be used to show that the decay width scales as the quintic power of mass. This can be checked from pdg files very easily with this gnuplot script:

  set logscale xy
  set key noautotitle
  plot "<cat Downloads/mass_width_2020.mcd|grep -v ^* | cut -c 32-" using "%20lf%*8lf%*8lf%16lf"
  replot 2.4952*(x/91.1876)**3
  replot 2.99591E-19*(x/0.105658)**5

The plot includes all the particles having mass and decay width listed in the particle data group datafile: mesons and baryons, some of their excited states, and also the Z0 and the W and the two unstable leptons, muon and tau. And the top quark. Higgs boson does not appear because its decay width is not yet in the table, proton does not appear because it is stable AFAWK, and well, the neutron does not appear because I have zoomed it out)

Units in the table are GeV (mass in the horizontal, decay width in the vertical). And you can appreciate the aforementioned quintic scaling as the blue line here.

a

But surprise, there is also an alignment for neutral, purely electromagnetic, decays. It is a cubic scaling. Is it an artifact, or can it be shown analytically?

To put more detail: the particles on the green line are $\pi^0, \eta, \Sigma^0, J/\Psi, \Psi(2S)$ and, rather peculiarly, the gauge bosons.

Particle Mass (Gev) Total Width (GeV) "Reduced Width" $MeV^{-2}$
$\pi^0$ 0.135 7.73E-9 3.1
$\eta$ 0.548 1.31E-6 8.0
$\Sigma^0$ 1.19 8.90E-6 5.3
$D^*$ 2.01 8.34E-5 10.3
$J/\Psi$ 3.10 9.29E-5 3.1
$\Psi(2S)$ 3.69 2.94E-4 5.9
$B(s2)^*$ 5.84 1.49E-3 7.5
$Z^0$ 91.2 2.50 3.3

The particles above the green line are all the mesons and baryons that have strong decay. For some of these, when the partial EM decay width is known, usually to $\gamma\gamma$, it also aligns on the green line. I have checked this for $\omega, \phi$ and $\eta'$.

It would seem that the hadronic scale, extracted via the "reduced width" $\Gamma/M^3$, has some general bound, the only exception being the three first states in the bottom quark sector: $\Upsilon(1S,2S,3S)$ happen to have some extra of stability allowing them to lie under the cubic line. But note $\Upsilon(4S)$ is already above it.

added 127 characters in body
Source Link
arivero
  • 1.9k
  • 18
  • 39

For beta decay of mesons, the heavy quark approximation and surely other techniques can be used to show that the decay width scales as the quintic power of mass. This can be checked from pdg files very easily with this gnuplot script:

  set logscale xy
  set key noautotitle
  plot "<cat Downloads/mass_width_2020.mcd|grep -v ^* | cut -c 32-" using "%20lf%*8lf%*8lf%16lf"
  replot 2.4952*(x/91.1876)**3
  replot 2.99591E-19*(x/0.105658)**5

The plot includes all the particles having mass and decay width listed in the particle data group datafile: mesons and baryons, some of their excited states, and also the Z0 and the W and the two unstable leptons, muon and tau. And the top quark. Higgs boson does not appear because its decay width is not yet in the table, proton does not appear because it is stable AFAWK, and well, the neutron does not appear because I have zoomed it out)

Units in the table are GeV (mass in the horizontal, decay width in the vertical). And you can appreciate the aforementioned quintic scaling as the blue line here.

a

But surprise, there is also an alignment for neutral, purely electromagnetic, decays. It is a cubic scaling. Is it an artifact, or can it be shown analytically?

To put more detail: the particles on the green line are $\pi^0, \eta, \Sigma^0, J/\Psi, \Psi(2S)$ and, rather peculiarly, the gauge bosons.

Particle Mass (Gev) Total Width (GeV) "Reduced Width" $MeV^{-2}$
$\pi^0$ 0.135 7.73E-9 3.1
$\eta$ 8.0
$\Sigma$ 5.3
$D^*$ 10.3
$J/\Psi$ 3.1
$\Psi(2S)$ 5.9
$B(s2)^*$ 7.5
$Z^0$ 3.3

The particles above the green line are all the mesons and baryons that have strong decay. For some of these, when the partial EM decay width is known, usually to $\gamma\gamma$, it also aligns on the green line. I have checked this for $\omega, \phi$ and $\eta'$. The

It would seem that the hadronic scale, extracted via the "reduced width" $\Gamma/M^3$, has some general bound, the only exception seems to bebeing the three first states in the bottom quark sector: The three first states of $\Upsilon$ happen$\Upsilon(1S,2S,3S)$ happen to have ansome extra of stability allowing them to lie under the cubic line. But note $\Upsilon(4S)$ is already above it.

For beta decay of mesons, the heavy quark approximation and surely other techniques can be used to show that the decay width scales as the quintic power of mass. This can be checked from pdg files very easily with this gnuplot script:

  set logscale xy
  set key noautotitle
  plot "<cat Downloads/mass_width_2020.mcd|grep -v ^* | cut -c 32-" using "%20lf%*8lf%*8lf%16lf"
  replot 2.4952*(x/91.1876)**3
  replot 2.99591E-19*(x/0.105658)**5

The plot includes all the particles having mass and decay width listed in the particle data group datafile: mesons and baryons, some of their excited states, and also the Z0 and the W and the two unstable leptons, muon and tau. And the top quark. Higgs boson does not appear because its decay width is not yet in the table, proton does not appear because it is stable AFAWK, and well, the neutron does not appear because I have zoomed it out)

Units in the table are GeV (mass in the horizontal, decay width in the vertical). And you can appreciate the aforementioned quintic scaling as the blue line here.

a

But surprise, there is also an alignment for neutral, purely electromagnetic, decays. It is a cubic scaling. Is it an artifact, or can it be shown analytically?

To put more detail: the particles on the green line are $\pi^0, \eta, \Sigma^0, J/\Psi, \Psi(2S)$ and, rather peculiarly, the gauge bosons.

Particle Mass (Gev) Total Width (GeV) "Reduced Width" $MeV^{-2}$
$\pi^0$ 0.135 7.73E-9 3.1
$\eta$ 8.0
$\Sigma$ 5.3
$D^*$ 10.3
$J/\Psi$ 3.1
$\Psi(2S)$ 5.9
$B(s2)^*$ 7.5
$Z^0$ 3.3

The particles above the green line are all the mesons and baryons that have strong decay. For some of these, when the partial EM decay width is known, usually to $\gamma\gamma$, it also aligns on the green line. I have checked this for $\omega, \phi$ and $\eta'$. The only exception seems to be the bottom quark sector: The three first states of $\Upsilon$ happen to have an extra of stability allowing them to lie under the cubic line. But $\Upsilon(4S)$ is already above it.

For beta decay of mesons, the heavy quark approximation and surely other techniques can be used to show that the decay width scales as the quintic power of mass. This can be checked from pdg files very easily with this gnuplot script:

  set logscale xy
  set key noautotitle
  plot "<cat Downloads/mass_width_2020.mcd|grep -v ^* | cut -c 32-" using "%20lf%*8lf%*8lf%16lf"
  replot 2.4952*(x/91.1876)**3
  replot 2.99591E-19*(x/0.105658)**5

The plot includes all the particles having mass and decay width listed in the particle data group datafile: mesons and baryons, some of their excited states, and also the Z0 and the W and the two unstable leptons, muon and tau. And the top quark. Higgs boson does not appear because its decay width is not yet in the table, proton does not appear because it is stable AFAWK, and well, the neutron does not appear because I have zoomed it out)

Units in the table are GeV (mass in the horizontal, decay width in the vertical). And you can appreciate the aforementioned quintic scaling as the blue line here.

a

But surprise, there is also an alignment for neutral, purely electromagnetic, decays. It is a cubic scaling. Is it an artifact, or can it be shown analytically?

To put more detail: the particles on the green line are $\pi^0, \eta, \Sigma^0, J/\Psi, \Psi(2S)$ and, rather peculiarly, the gauge bosons.

Particle Mass (Gev) Total Width (GeV) "Reduced Width" $MeV^{-2}$
$\pi^0$ 0.135 7.73E-9 3.1
$\eta$ 8.0
$\Sigma$ 5.3
$D^*$ 10.3
$J/\Psi$ 3.1
$\Psi(2S)$ 5.9
$B(s2)^*$ 7.5
$Z^0$ 3.3

The particles above the green line are all the mesons and baryons that have strong decay. For some of these, when the partial EM decay width is known, usually to $\gamma\gamma$, it also aligns on the green line. I have checked this for $\omega, \phi$ and $\eta'$.

It would seem that the hadronic scale, extracted via the "reduced width" $\Gamma/M^3$, has some general bound, the only exception being the three first states in the bottom quark sector: $\Upsilon(1S,2S,3S)$ happen to have some extra of stability allowing them to lie under the cubic line. But note $\Upsilon(4S)$ is already above it.

added 334 characters in body
Source Link
arivero
  • 1.9k
  • 18
  • 39

For beta decay of mesons, the heavy quark approximation and surely other techniques can be used to show that the decay width scales as the quintic power of mass. This can be checked from pdg files very easily with this gnuplot script:

  set logscale xy
  set key noautotitle
  plot "<cat Downloads/mass_width_2020.mcd|grep -v ^* | cut -c 32-" using "%20lf%*8lf%*8lf%16lf"
  replot 2.4952*(x/91.1876)**3
  replot 2.99591E-19*(x/0.105658)**5

The plot includes all the particles having mass and decay width listed in the particle data group datafile: mesons and baryons, some of their excited states, and also the Z0 and the W and the two unstable leptons, muon and tau. And the top quark. Higgs boson does not appear because its decay width is not yet in the table, proton does not appear because it is stable AFAWK, and well, the neutron does not appear because I have zoomed it out)

Units in the table are GeV (mass in the horizontal, decay width in the vertical). And you can appreciate the aforementioned quintic scaling as the blue line here.

a

But surprise, there is also an alignment for neutral, purely electromagnetic, decays. It is a cubic scaling. Is it an artifact, or can it be shown analytically?

To put more detail: the particles on the green line are $\pi^0, \eta, \Sigma^0, J/\Psi, \Psi(2S)$ and, rather peculiarly, the gauge bosons.

ParticleMass (Gev)Total Width (GeV)"Reduced Width" $MeV^{-2}$
$\pi^0$0.1357.73E-93.1
$\eta$8.0
$\Sigma$5.3
$D^*$10.3
$J/\Psi$3.1
$\Psi(2S)$5.9
$B(s2)^*$7.5
$Z^0$3.3

The particles above the green line are all the mesons and baryons that have strong decay. For some of these, when the partial EM decay width is known, usually to $\gamma\gamma$, it also aligns on the green line. I have checked this for $\omega, \phi$ and $\eta'$. The only exception seems to be the bottom quark sector: The three first states of $\Upsilon$ happen to have an extra of stability allowing them to lie under the cubic line. But $\Upsilon(4S)$ is already above it.

For beta decay of mesons, the heavy quark approximation and surely other techniques can be used to show that the decay width scales as the quintic power of mass. This can be checked from pdg files very easily with this gnuplot script:

  set logscale xy
  set key noautotitle
  plot "<cat Downloads/mass_width_2020.mcd|grep -v ^* | cut -c 32-" using "%20lf%*8lf%*8lf%16lf"
  replot 2.4952*(x/91.1876)**3
  replot 2.99591E-19*(x/0.105658)**5

The plot includes all the particles having mass and decay width listed in the particle data group datafile: mesons and baryons, some of their excited states, and also the Z0 and the W and the two unstable leptons, muon and tau. And the top quark. Higgs boson does not appear because its decay width is not yet in the table, proton does not appear because it is stable AFAWK, and well, the neutron does not appear because I have zoomed it out)

Units in the table are GeV (mass in the horizontal, decay width in the vertical). And you can appreciate the aforementioned quintic scaling as the blue line here.

a

But surprise, there is also an alignment for neutral, purely electromagnetic, decays. It is a cubic scaling. Is it an artifact, or can it be shown analytically?

To put more detail: the particles on the green line are $\pi^0, \eta, \Sigma^0, J/\Psi, \Psi(2S)$ and, rather peculiarly, the gauge bosons. The particles above the green line are all the mesons and baryons that have strong decay. For some of these, when the partial EM decay width is known, usually to $\gamma\gamma$, it also aligns on the green line. I have checked this for $\omega, \phi$ and $\eta'$. The only exception seems to be the bottom quark sector: The three first states of $\Upsilon$ happen to have an extra of stability allowing them to lie under the cubic line. But $\Upsilon(4S)$ is already above it.

For beta decay of mesons, the heavy quark approximation and surely other techniques can be used to show that the decay width scales as the quintic power of mass. This can be checked from pdg files very easily with this gnuplot script:

  set logscale xy
  set key noautotitle
  plot "<cat Downloads/mass_width_2020.mcd|grep -v ^* | cut -c 32-" using "%20lf%*8lf%*8lf%16lf"
  replot 2.4952*(x/91.1876)**3
  replot 2.99591E-19*(x/0.105658)**5

The plot includes all the particles having mass and decay width listed in the particle data group datafile: mesons and baryons, some of their excited states, and also the Z0 and the W and the two unstable leptons, muon and tau. And the top quark. Higgs boson does not appear because its decay width is not yet in the table, proton does not appear because it is stable AFAWK, and well, the neutron does not appear because I have zoomed it out)

Units in the table are GeV (mass in the horizontal, decay width in the vertical). And you can appreciate the aforementioned quintic scaling as the blue line here.

a

But surprise, there is also an alignment for neutral, purely electromagnetic, decays. It is a cubic scaling. Is it an artifact, or can it be shown analytically?

To put more detail: the particles on the green line are $\pi^0, \eta, \Sigma^0, J/\Psi, \Psi(2S)$ and, rather peculiarly, the gauge bosons.

ParticleMass (Gev)Total Width (GeV)"Reduced Width" $MeV^{-2}$
$\pi^0$0.1357.73E-93.1
$\eta$8.0
$\Sigma$5.3
$D^*$10.3
$J/\Psi$3.1
$\Psi(2S)$5.9
$B(s2)^*$7.5
$Z^0$3.3

The particles above the green line are all the mesons and baryons that have strong decay. For some of these, when the partial EM decay width is known, usually to $\gamma\gamma$, it also aligns on the green line. I have checked this for $\omega, \phi$ and $\eta'$. The only exception seems to be the bottom quark sector: The three first states of $\Upsilon$ happen to have an extra of stability allowing them to lie under the cubic line. But $\Upsilon(4S)$ is already above it.

added 50 characters in body
Source Link
arivero
  • 1.9k
  • 18
  • 39
Loading
added 338 characters in body
Source Link
arivero
  • 1.9k
  • 18
  • 39
Loading
added 338 characters in body
Source Link
arivero
  • 1.9k
  • 18
  • 39
Loading
added 338 characters in body
Source Link
arivero
  • 1.9k
  • 18
  • 39
Loading
edited tags
Link
Qmechanic
  • 212.7k
  • 48
  • 589
  • 2.3k
Loading
added 271 characters in body
Source Link
arivero
  • 1.9k
  • 18
  • 39
Loading
tidying
Source Link
rob
  • 94.2k
  • 20
  • 177
  • 353
Loading
added 259 characters in body
Source Link
arivero
  • 1.9k
  • 18
  • 39
Loading
Source Link
arivero
  • 1.9k
  • 18
  • 39
Loading