added 20 characters in body
Source Link
user137289
user137289

The ideal gas law $pV=nRT$ is only valid for ideal gases, where interactions between molecules are negligible.

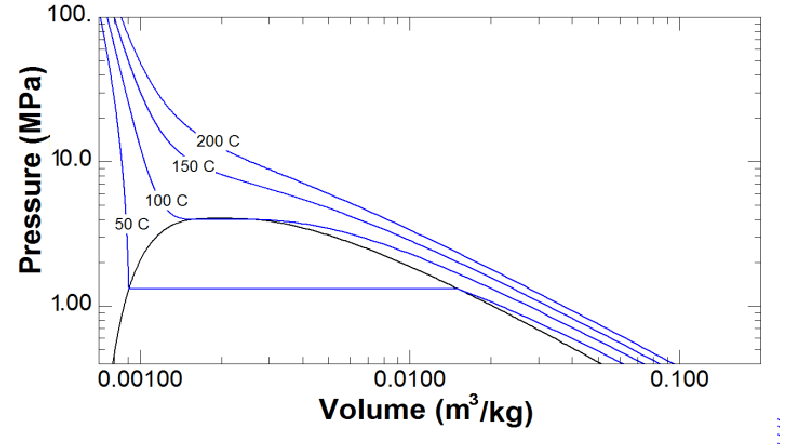
Here is a $pV$-diagram for R134a as a log-log plot:

pV-diagram of R134a

At low densities, the isotherm at 200 C$200\ ^\circ$C behaves like an ideal gas, a straight line with a slope of -1.

At higher densities, there are interactions. For temperatures below the critical point this leads to coexistence of liquid and vapor, with horizontal sections of the isotherms.

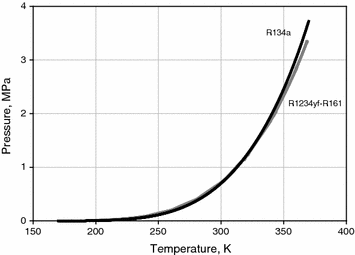
The vapor pressure in the two-phase area increases approximately exponentially with temperature, up to the critical point at 101 C$101\ ^\circ$C and 40$40$ bar: enter image description here
The ideal gas law $pV=nRT$ is only valid for ideal gases, where interactions between molecules are negligible.

Here is a $pV$-diagram for R134a as a log-log plot:

pV-diagram of R134a

At low densities, the isotherm at 200 C behaves like an ideal gas, a straight line with a slope of -1.

At higher densities, there are interactions. For temperatures below the critical point this leads to coexistence of liquid and vapor, with horizontal sections of the isotherms.

The vapor pressure in the two-phase area increases approximately exponentially with temperature, up to the critical point at 101 C and 40 bar: enter image description here

The ideal gas law $pV=nRT$ is only valid for ideal gases, where interactions between molecules are negligible.

Here is a $pV$-diagram for R134a as a log-log plot:

pV-diagram of R134a

At low densities, the isotherm at $200\ ^\circ$C behaves like an ideal gas, a straight line with a slope of -1.

At higher densities, there are interactions. For temperatures below the critical point this leads to coexistence of liquid and vapor, with horizontal sections of the isotherms.

The vapor pressure in the two-phase area increases approximately exponentially with temperature, up to the critical point at $101\ ^\circ$C and $40$ bar: enter image description here

added 188 characters in body
Source Link
user137289
user137289

The ideal gas law $pV=nRT$ is only valid for ideal gases, where interactions between molecules are negligible.

Here is a $pV$-diagram for R134a as a log-log plot:

pV-diagram of R134a

At low densities, the isotherm at 200 C behaves like an ideal gas, a straight line with a slope of -1.

At higher densities, there are interactions. For temperatures below the critical point this leads to coexistence of liquid and vapor, with horizontal sections of the isotherms.

The vapor pressure in the two-phase area increases approximately exponentially with temperature, up to the critical point at 101 C and 40 bar: enter image description here

The ideal gas law $pV=nRT$ is only valid for ideal gases, where interactions between molecules are negligible.

Here is a $pV$-diagram for R134a as a log-log plot:

pV-diagram of R134a

At low densities, the isotherm at 200 C behaves like an ideal gas, a straight line with a slope of -1.

At higher densities, there are interactions. For temperatures below the critical point this leads to coexistence of liquid and vapor, with horizontal sections of the isotherms.

The vapor pressure in the two-phase area increases approximately exponentially with temperature, up to the critical point at 101 C and 40 bar: enter image description here

Source Link
user137289
user137289

The ideal gas law $pV=nRT$ is only valid for ideal gases, where interactions between molecules are negligible.

Here is a $pV$-diagram for R134a as a log-log plot:

pV-diagram of R134a

At low densities, the isotherm at 200 C behaves like an ideal gas, a straight line with a slope of -1.

At higher densities, there are interactions. For temperatures below the critical point this leads to coexistence of liquid and vapor, with horizontal sections of the isotherms.