One of the reasons stems from extreme value statistics. Objects break at their least resistant (call it softest) spot. The probability of having a softer spot is larger in a larger object.
You could think of a chain with $N$ links. Each link has a maximum force it can bear, $F$. Since links are not all the same, $F$ comes from a probability distribution, $P(F)$. Then the resistance to tear of the entire chain is the minimum $F$ out of $N$ values. So now you have $F_1, F_2, ..., F_N$ values but the overall force the chain can bear is the minimum out of those. The larger the number of the links $N$, the larger the probability you'll find a weaker link. The weakest link hypothesis and the resulting extremal statistics is widely used in mechanical engineering to estimate the yield strength of various materials and structures.
If you code a little, you can play around yourself: throw $N$ random numbers according to any distribution and take the minimum of these. You can average over several independent runs, and get the average minimum value out of $N$ random numbers. Then see how this average minimum value changes with $N$. Below is a small Python code that just does that:
import numpy as np
import pylab as pl

min_N = []
for N in range(10,1000):
    min_current = 0
    for realizations in range(100):
        min_current+=np.min(np.random.rand(N))/100.0
    min_N.append(min_current)

pl.loglog(range(10,1000), min_N)
pl.xlabel('N', fontsize=22)
pl.ylabel('min(N)', fontsize=22)
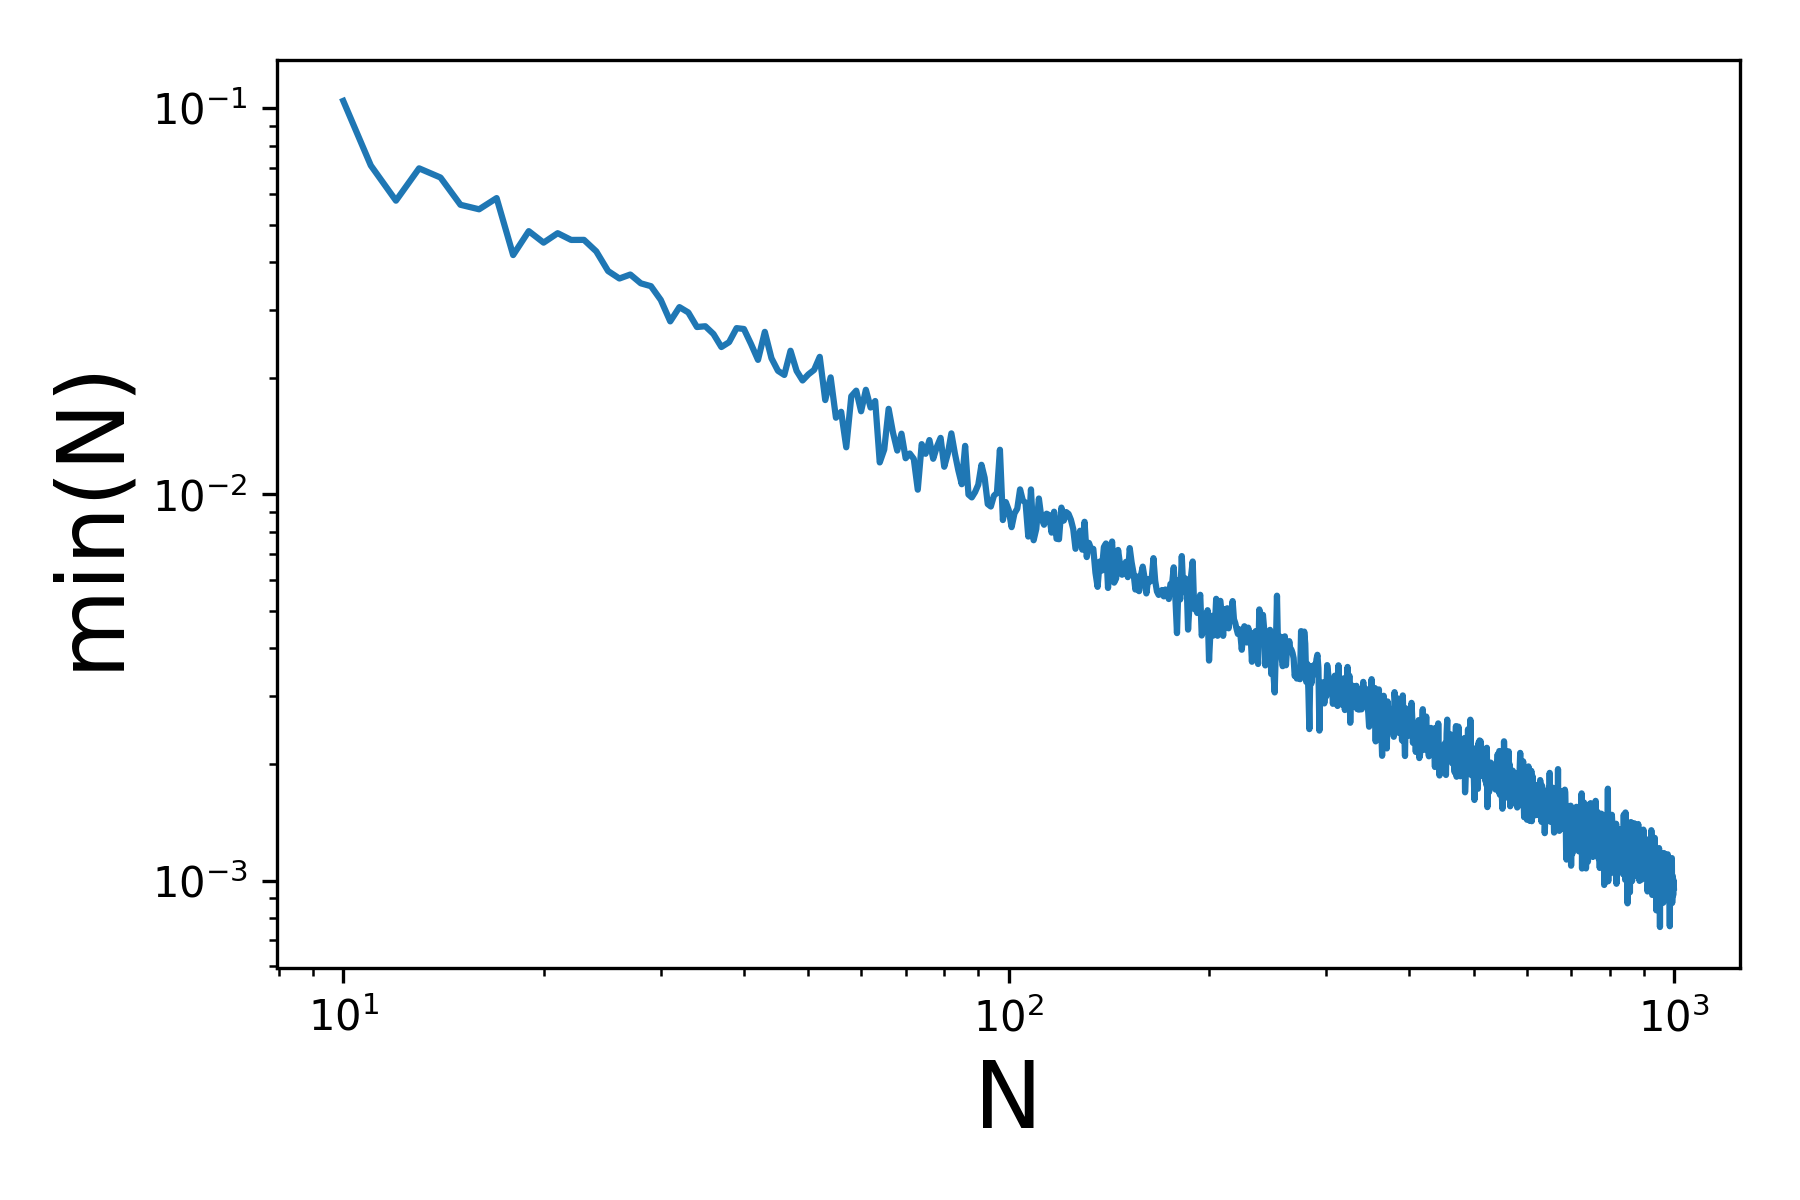
and the result:

So now you can see that the minimum of $N$ uniformly distributed random numbers (i.e. the strength of the chain) decreases with $N$. This is a log-log plot so looks like it decreases as a power law.

