SnelliusSnell's law tells us that the angle of refraction depends on the index of refraction, $n_1 \sin{\alpha_1} = n_2 \sin{\alpha_2}$. However, the question remains, why $n_{blue} > n_{red}$$n_{\text{blue}} > n_{\text{red}}$. In order to address this, we need a model for the refractive index.

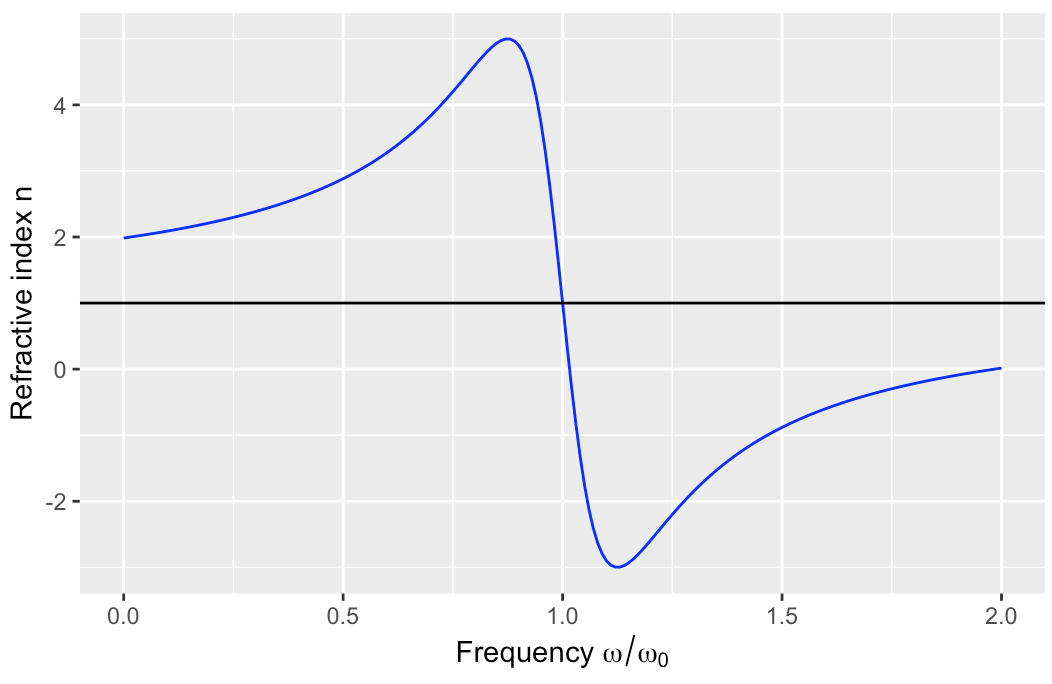
The refractive index $n$ of a material is related to the atomic transitions of the material. To a good approximation the atomic transition can be modelled as an harmonic oscillator, with eigenfrequency $\omega_0$. This leads to $$ n = 1 + \frac{preFactor}{\omega_0} \cdot\frac{\omega_0- \omega}{(\omega_0- \omega)^2 + (\gamma/2)^2} $$$$ n = 1 + \frac{\text{pre factor}}{\omega_0} \cdot\frac{\omega_0- \omega}{(\omega_0- \omega)^2 + (\gamma/2)^2} $$ where the pre factor is not dimensionless. Plotting the refractive index over the frequency yields   

simpleHarmOsci

If we consider glass, the atomic transitions are at higher frequencies compared to the frequency in the visible range. Thus, the refractive index of visible light corresponds to the left side of the plot. Here we see, that the refractive index increases with increasing frequency. Hence, the plot "explains" why $n_{blue} > n_{red}$$n_{\text{blue}} > n_{\text{red}}$.

Snellius law tells us that the angle of refraction depends on the index of refraction, $n_1 \sin{\alpha_1} = n_2 \sin{\alpha_2}$. However, the question remains, why $n_{blue} > n_{red}$. In order to address this, we need a model for the refractive index.

The refractive index $n$ of a material is related to the atomic transitions of the material. To a good approximation the atomic transition can be modelled as an harmonic oscillator, with eigenfrequency $\omega_0$. This leads to $$ n = 1 + \frac{preFactor}{\omega_0} \cdot\frac{\omega_0- \omega}{(\omega_0- \omega)^2 + (\gamma/2)^2} $$ where the pre factor is not dimensionless. Plotting the refractive index over the frequency yields  simpleHarmOsci

If we consider glass, the atomic transitions are at higher frequencies compared to the frequency in the visible range. Thus, the refractive index of visible light corresponds to the left side of the plot. Here we see, that the refractive index increases with increasing frequency. Hence, the plot "explains" why $n_{blue} > n_{red}$.

Snell's law tells us that the angle of refraction depends on the index of refraction, $n_1 \sin{\alpha_1} = n_2 \sin{\alpha_2}$. However, the question remains, why $n_{\text{blue}} > n_{\text{red}}$. In order to address this, we need a model for the refractive index.

The refractive index $n$ of a material is related to the atomic transitions of the material. To a good approximation the atomic transition can be modelled as an harmonic oscillator, with eigenfrequency $\omega_0$. This leads to $$ n = 1 + \frac{\text{pre factor}}{\omega_0} \cdot\frac{\omega_0- \omega}{(\omega_0- \omega)^2 + (\gamma/2)^2} $$ where the pre factor is not dimensionless. Plotting the refractive index over the frequency yields 

simpleHarmOsci

If we consider glass, the atomic transitions are at higher frequencies compared to the frequency in the visible range. Thus, the refractive index of visible light corresponds to the left side of the plot. Here we see, that the refractive index increases with increasing frequency. Hence, the plot "explains" why $n_{\text{blue}} > n_{\text{red}}$.

spelling
Source Link
NotMe
  • 9.3k
  • 1
  • 15
  • 35

Snellius law tells us that the angle of refraction depends on the index of refraction, $n_1 \sin{\alpha_1} = n_2 \sin{\alpha_2}$. However, the question remains, why $n_{blue} > n_{red}$. In order to address this, we need a model for the refractive index.

The refractive index $n$ of a material is related to the atomic transitions of the material. To a good approximation the atomic transition can be modelled as an harmonic oscillator, with eigenfrequency $\omega_0$. This leads to $$ n = 1 + \frac{preFactor}{\omega_0} \cdot\frac{\omega_0- \omega}{(\omega_0- \omega)^2 + (\gamma/2)^2} $$ where the pre factor is not dimensionless. Plotting the refractive index over the frequency yields simpleHarmOsci

If we consider glass, the atomic transitions are at higher frequencies compared to the frequency in the visible range. Thus, the refractive index of visible light corresponds to the left side of the plot. Here we see, that the refractive index increases with increasing frequency. Hence, the plot "explains" why $n_{blue} > n_{red}$.

Snellius law tells us that the angle of refraction depends on the index of refraction, $n_1 \sin{\alpha_1} = n_2 \sin{\alpha_2}$. However, the question remains, why $n_{blue} > n_{red}$. In order to address this, we need a model for the refractive index.

The refractive index $n$ of a material is related to the atomic transitions of the material. To a good approximation the atomic transition can be modelled as an harmonic oscillator, with eigenfrequency $\omega_0$. This leads to $$ n = 1 + \frac{preFactor}{\omega_0} \cdot\frac{\omega_0- \omega}{(\omega_0- \omega)^2 + (\gamma/2)^2} $$ where the pre factor is not dimensionless. Plotting the refractive index over the frequency yields simpleHarmOsci

If we consider glass, the atomic transitions are at higher frequencies compared to the frequency the visible range. Thus, the refractive index of visible light corresponds to the left side of the plot. Here we see, that the refractive index increases with increasing frequency. Hence, the plot "explains" why $n_{blue} > n_{red}$.

Snellius law tells us that the angle of refraction depends on the index of refraction, $n_1 \sin{\alpha_1} = n_2 \sin{\alpha_2}$. However, the question remains, why $n_{blue} > n_{red}$. In order to address this, we need a model for the refractive index.

The refractive index $n$ of a material is related to the atomic transitions of the material. To a good approximation the atomic transition can be modelled as an harmonic oscillator, with eigenfrequency $\omega_0$. This leads to $$ n = 1 + \frac{preFactor}{\omega_0} \cdot\frac{\omega_0- \omega}{(\omega_0- \omega)^2 + (\gamma/2)^2} $$ where the pre factor is not dimensionless. Plotting the refractive index over the frequency yields simpleHarmOsci

If we consider glass, the atomic transitions are at higher frequencies compared to the frequency in the visible range. Thus, the refractive index of visible light corresponds to the left side of the plot. Here we see, that the refractive index increases with increasing frequency. Hence, the plot "explains" why $n_{blue} > n_{red}$.

Source Link
NotMe
  • 9.3k
  • 1
  • 15
  • 35

Snellius law tells us that the angle of refraction depends on the index of refraction, $n_1 \sin{\alpha_1} = n_2 \sin{\alpha_2}$. However, the question remains, why $n_{blue} > n_{red}$. In order to address this, we need a model for the refractive index.

The refractive index $n$ of a material is related to the atomic transitions of the material. To a good approximation the atomic transition can be modelled as an harmonic oscillator, with eigenfrequency $\omega_0$. This leads to $$ n = 1 + \frac{preFactor}{\omega_0} \cdot\frac{\omega_0- \omega}{(\omega_0- \omega)^2 + (\gamma/2)^2} $$ where the pre factor is not dimensionless. Plotting the refractive index over the frequency yields simpleHarmOsci

If we consider glass, the atomic transitions are at higher frequencies compared to the frequency the visible range. Thus, the refractive index of visible light corresponds to the left side of the plot. Here we see, that the refractive index increases with increasing frequency. Hence, the plot "explains" why $n_{blue} > n_{red}$.