Periodic functions $f(t)$ (with a time period $T$) can be approximated by a Fourier series, i.e. by summing harmonic oscillations with the discrete frequencies $0, \frac{2\pi}{T}, 2\frac{2\pi}{T}, 3\frac{2\pi}{T}, \ldots$ . $$f(t)=\sum_{n=-\infty}^{+\infty} F_n e^{in\frac{2\pi}{T}t}$$
But, as you already noticed, with a Fourier series you cannot build aperiodic functions (e.g. functions limited to a finite range). For approximating such functions you need a Fourier integral, i.e. summing harmonic oscillations with all frequencies from $0$ to $\infty$. $$f(t)=\int_{-\infty}^{+\infty}F(\omega)e^{i\omega t}\ d\omega$$
Example 1: Periodic function $\to$ discrete spectrum
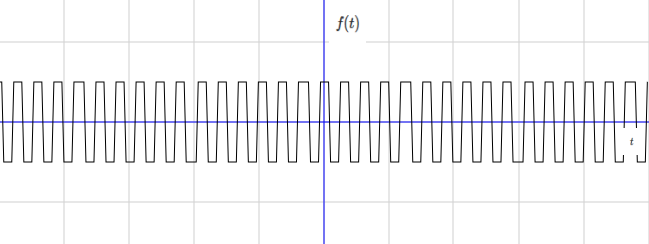
As an example for $f(t)$ let's choose the rectangular
waverectangular
wave (with period $T$) extending from $t=-\infty$ to $t=+\infty$.


$f(t)$ is a perfectly periodic function, and therefore
can be decomposed into a Fourier series.
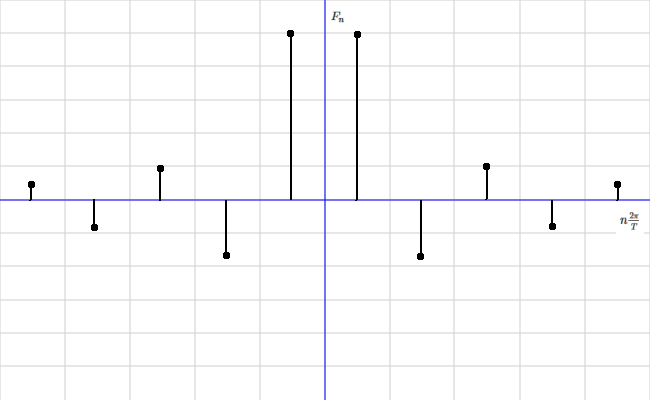
Its spectrum (the Fourier coefficients $F_n$) look like this:


Eaxample 2: Aperiodic function $\to$ continuous spectrum
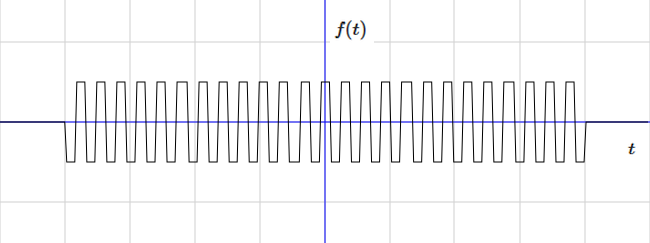
Now as a second example for $f(t)$ let's choose the rectangular
wave (again with period $T$) restricted to a certain range.
Outside this range we define $f(t)=0$.


Obviously this function is quite similar to the first example.
Therefore we expect its spectrum to be somehow similar to the
spectrum of the first example.
Because $f(t)$ is aperiodic, it cannot be decomposed into a
Fourier series. But it can be decomposed into a Fourier integral.
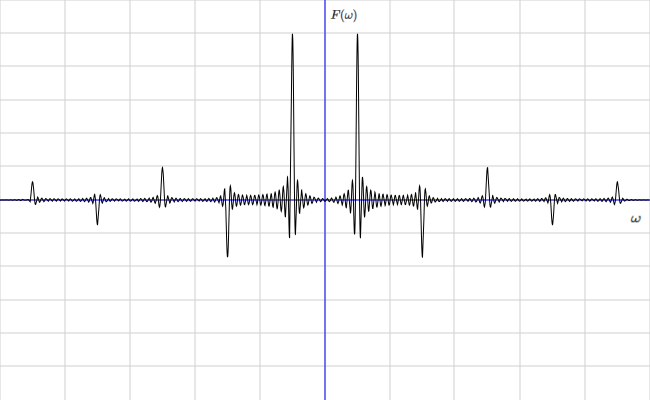
Its Fourier spectrum (the function $F(\omega)$) looks like this:


(Function plots created with FooPlot)
This spectrum is continuous, but still quite similar to the discrete spectrum of the first eample. It has some pronounced peaks (at the same frequencies as in the first example). But there is also some spectral intensity outside of these peaks.
