All the graphs shown below come from completely different fields of studies and still, they share a similar distribution pattern.
Why most distribution curves Bell Shaped? Is there any physical law that leads the curve to take that shape?
Is there any explanation in Quantum Mechanics for these various graphs to take that shape?
Is there any intuitive explanation behind why these graphs are Bell Shaped?
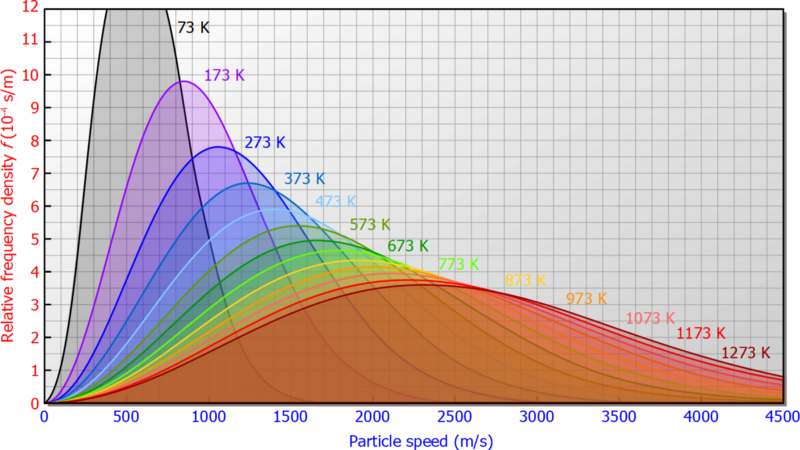
Following is Maxwell’s Distribution of Velocity Curve, in Kinetic Theory of Gases.
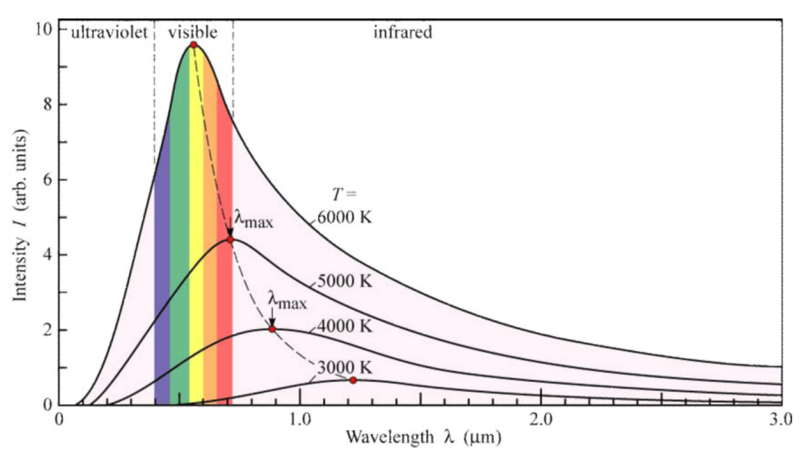
Following is the Wein’s Displacement Law, in Thermal Radiations.
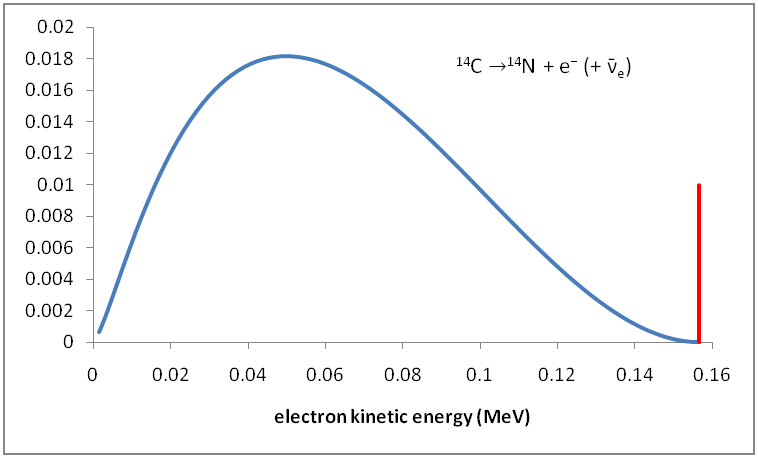
Following is the Distribution of Kinetic Energy of Beta Particles in Radioactive Decays.


