fix mis-statement of figure key
Source Link

Shell models of the nucleus propose orbitals for nucleons much like those we see for electrons in an atom, but the "distances between them" (measured from regions of maximal likelihood or somesuch) are comparable to the size of the nucleons, so they can't really be thought of as separated in the way one can figure that atomic electrons have regions of maximal likelihood that are distinct from one another. That's why the liquid drop models that nate mentions were pretty useful.

The models require as inputs some potentials and form-factors that are not as well understood as those that affect electrons. Further the shell model must be solved numerically in all but the simplest cases so the results are only approximate.

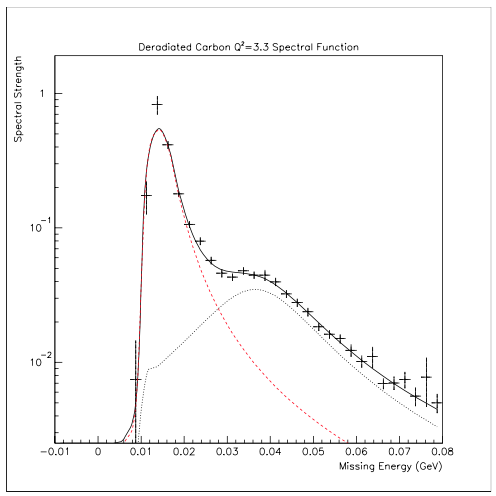
My dissertation work included taking pictures of the shell distributions (of protons only) in momentum space. Here is one view of a carbon nucleus (after considerable manipulation to approximately remove the final state effects):

enter image description here

the horizontal scale is basically binding energy and you can see the p- (high peak on the left) and s-shells (low peak on the right). The vertical scale has arbitrary units. The lines are to guides the eye only as they have limited physics content.

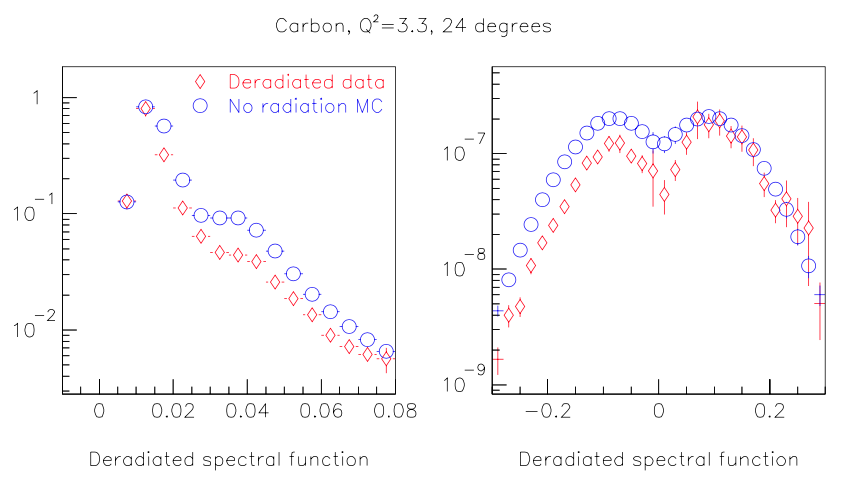
This figure shows both the energy dependence and the momentum dependence

enter image description here

where the blue circularred diamond markers represent the (manipulated to approximately remove final-state interactions) data and the red diamondblue circular markers the result of a Monte Carlo calculation based on a shell model using earlier spectral functions and the de Forest prescription for the nuclear form-factors. As before the vertical scale is arbitrary and the horizontal scale is in GeV (natural units).

The double-bump in the momentum data are (in effect) the lobes of the p-orbitals, and the fact that the center is distinctly non-zero is the mark of the s-orbital.

Spatial distributions of bound objects are related to the momentum distributions by a Fourier transformation. You can't actually work that transformation on this figure because it is in energy rather than momentum space, but you might well guess that there would be a lot of spatial overlap and you would be right.

Shell models of the nucleus propose orbitals for nucleons much like those we see for electrons in an atom, but the "distances between them" (measured from regions of maximal likelihood or somesuch) are comparable to the size of the nucleons, so they can't really be thought of as separated in the way one can figure that atomic electrons have regions of maximal likelihood that are distinct from one another. That's why the liquid drop models that nate mentions were pretty useful.

The models require as inputs some potentials and form-factors that are not as well understood as those that affect electrons. Further the shell model must be solved numerically in all but the simplest cases so the results are only approximate.

My dissertation work included taking pictures of the shell distributions (of protons only) in momentum space. Here is one view of a carbon nucleus (after considerable manipulation to approximately remove the final state effects):

enter image description here

the horizontal scale is basically binding energy and you can see the p- (high peak on the left) and s-shells (low peak on the right). The vertical scale has arbitrary units. The lines are to guides the eye only as they have limited physics content.

This figure shows both the energy dependence and the momentum dependence

enter image description here

where the blue circular markers represent the (manipulated to approximately remove final-state interactions) data and the red diamond markers the result of a Monte Carlo calculation based on a shell model using earlier spectral functions and the de Forest prescription for the nuclear form-factors. As before the vertical scale is arbitrary and the horizontal scale is in GeV (natural units).

The double-bump in the momentum data are (in effect) the lobes of the p-orbitals, and the fact that the center is distinctly non-zero is the mark of the s-orbital.

Spatial distributions of bound objects are related to the momentum distributions by a Fourier transformation. You can't actually work that transformation on this figure because it is in energy rather than momentum space, but you might well guess that there would be a lot of spatial overlap and you would be right.
Shell models of the nucleus propose orbitals for nucleons much like those we see for electrons in an atom, but the "distances between them" (measured from regions of maximal likelihood or somesuch) are comparable to the size of the nucleons, so they can't really be thought of as separated in the way one can figure that atomic electrons have regions of maximal likelihood that are distinct from one another. That's why the liquid drop models that nate mentions were pretty useful.

The models require as inputs some potentials and form-factors that are not as well understood as those that affect electrons. Further the shell model must be solved numerically in all but the simplest cases so the results are only approximate.

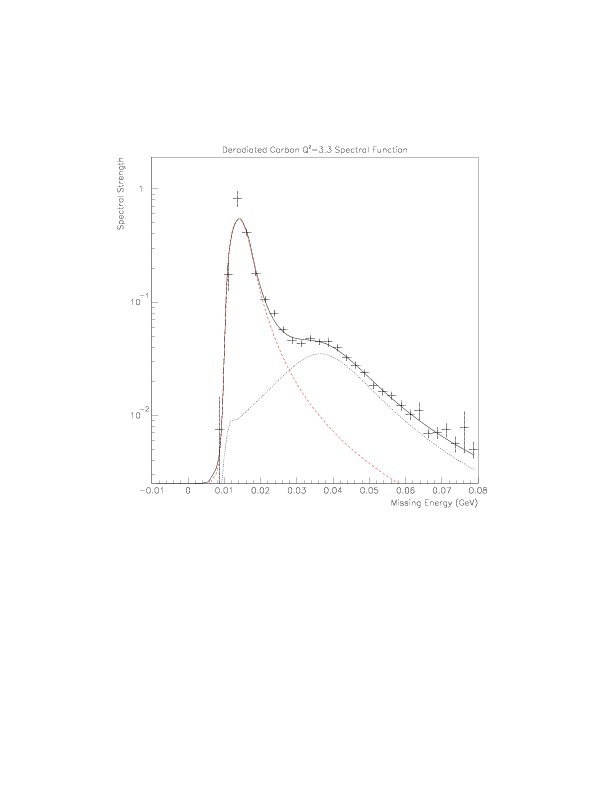
My dissertation work included taking pictures of the shell distributions (of protons only) in momentum space. Here is one view of a carbon nucleus (after considerable manipulation to approximately remove the final state effects):

enter image description here

the horizontal scale is basically binding energy and you can see the p- (high peak on the left) and s-shells (low peak on the right). The vertical scale has arbitrary units. The lines are to guides the eye only as they have limited physics content.

This figure shows both the energy dependence and the momentum dependence

enter image description here

where the red diamond markers represent the (manipulated to approximately remove final-state interactions) data and the blue circular markers the result of a Monte Carlo calculation based on a shell model using earlier spectral functions and the de Forest prescription for the nuclear form-factors. As before the vertical scale is arbitrary and the horizontal scale is in GeV (natural units).

The double-bump in the momentum data are (in effect) the lobes of the p-orbitals, and the fact that the center is distinctly non-zero is the mark of the s-orbital.

Spatial distributions of bound objects are related to the momentum distributions by a Fourier transformation. You can't actually work that transformation on this figure because it is in energy rather than momentum space, but you might well guess that there would be a lot of spatial overlap and you would be right.
Get around to adding a figure that explicitly shows the momentum distribution. Improve the discussion a little.
Source Link

Shell models of the nucleus propose orbitals for nucleons much like those we see for electrons in an atom, but the "distances between them" (measured from regions of maximal likelihood or somesuch) are comparable to the size of the nucleons, so they can't really be thought of as separated in the way one can figure that atomic electrons have regions of maximal likelihood that are distinct from one another. That's why the liquid drop models that nate mentions were pretty useful.

The models require as inputs some potentials and form-factors that are not as well understood as those that affect electrons. Further the shell model must be solved numerically in all but the simplest cases so the results are only approximate.

My dissertation work included taking pictures of the shell distributions (of protons only) in momentum space. Here is one view of a carbon nucleus (after considerable manipulation to approximately remove the final state effects):

enter image description hereenter image description here

the horizontal scale is basically binding energy and you can see the p- (high peak on the left) and s-shells (low peak on the right). The vertical scale has arbitrary units. The lines are to guides the eye only as they have limited physics content.

This figure shows both the energy dependence and the momentum dependence

enter image description here

where the blue circular markers represent the (manipulated to approximately remove final-state interactions) data and the red diamond markers the result of a Monte Carlo calculation based on a shell model using earlier spectral functions and the de Forest prescription for the nuclear form-factors. As before the vertical scale is arbitrary and the horizontal scale is in GeV (natural units).

The double-bump in the momentum data are (in effect) the lobes of the p-orbitals, and the fact that the center is distinctly non-zero is the mark of the s-orbital.

Spatial distributions of bound objects are related to the momentum distributions by a Fourier transformation. You can't actually work that transformation on this figure because it is in energy rather than momentum space, but you might well guess that there would be a lot of spatial overlap and you would be right.

Shell models of the nucleus propose orbitals for nucleons much like those we see for electrons in an atom, but the "distances between them" (measured from regions of maximal likelihood or somesuch) are comparable to the size of the nucleons, so they can't really be thought of as separated in the way one can figure that atomic electrons have regions of maximal likelihood that are distinct from one another. That's why the liquid drop models that nate mentions were pretty useful.

The models require as inputs some potentials and form-factors that are not as well understood as those that affect electrons. Further the shell model must be solved numerically in all but the simplest cases so the results are only approximate.

My dissertation work included taking pictures of the shell distributions (of protons only) in momentum space. Here is one view of a carbon nucleus (after considerable manipulation to approximately remove the final state effects):

enter image description here

the horizontal scale is basically binding energy and you can see the p- (high peak on the left) and s-shells (low peak on the right). The lines are to guides the eye only as they have limited physics content.

Spatial distributions of bound objects are related to the momentum distributions by a Fourier transformation. You can't actually work that transformation on this figure because it is in energy rather than momentum space, but you might well guess that there would be a lot of spatial overlap and you would be right.

Shell models of the nucleus propose orbitals for nucleons much like those we see for electrons in an atom, but the "distances between them" (measured from regions of maximal likelihood or somesuch) are comparable to the size of the nucleons, so they can't really be thought of as separated in the way one can figure that atomic electrons have regions of maximal likelihood that are distinct from one another. That's why the liquid drop models that nate mentions were pretty useful.

The models require as inputs some potentials and form-factors that are not as well understood as those that affect electrons. Further the shell model must be solved numerically in all but the simplest cases so the results are only approximate.

My dissertation work included taking pictures of the shell distributions (of protons only) in momentum space. Here is one view of a carbon nucleus (after considerable manipulation to approximately remove the final state effects):

enter image description here

the horizontal scale is basically binding energy and you can see the p- (high peak on the left) and s-shells (low peak on the right). The vertical scale has arbitrary units. The lines are to guides the eye only as they have limited physics content.

This figure shows both the energy dependence and the momentum dependence

enter image description here

where the blue circular markers represent the (manipulated to approximately remove final-state interactions) data and the red diamond markers the result of a Monte Carlo calculation based on a shell model using earlier spectral functions and the de Forest prescription for the nuclear form-factors. As before the vertical scale is arbitrary and the horizontal scale is in GeV (natural units).

The double-bump in the momentum data are (in effect) the lobes of the p-orbitals, and the fact that the center is distinctly non-zero is the mark of the s-orbital.

Spatial distributions of bound objects are related to the momentum distributions by a Fourier transformation. You can't actually work that transformation on this figure because it is in energy rather than momentum space, but you might well guess that there would be a lot of spatial overlap and you would be right.

replaced http://physics.stackexchange.com/ with https://physics.stackexchange.com/
Source Link

Shell models of the nucleus propose orbitals for nucleons much like those we see for electrons in an atom, but the "distances between them" (measured from regions of maximal likelihood or somesuch) are comparable to the size of the nucleons, so they can't really be thought of as separated in the way one can figure that atomic electrons have regions of maximal likelihood that are distinct from one another. That's why the liquid drop models that nate mentionsliquid drop models that nate mentions were pretty useful.

The models require as inputs some potentialspotentials andand formform-factorsfactors that are not as well understood as those that affect electrons. Further the shell model must be solved numerically in all but the simplest cases so the results are only approximate.

My dissertation work included taking pictures of the shell distributions (of protons only) in momentum space. Here is one view of a carbon nucleus (after considerable manipulation to approximately remove the final state effects):

enter image description here

the horizontal scale is basically binding energy and you can see the p- (high peak on the left) and s-shells (low peak on the right). The lines are to guides the eye only as they have limited physics content.

Spatial distributions of bound objects are related to the momentum distributions by a Fourier transformation. You can't actually work that transformation on this figure because it is in energy rather than momentum space, but you might well guess that there would be a lot of spatial overlap and you would be right.

Shell models of the nucleus propose orbitals for nucleons much like those we see for electrons in an atom, but the "distances between them" (measured from regions of maximal likelihood or somesuch) are comparable to the size of the nucleons, so they can't really be thought of as separated in the way one can figure that atomic electrons have regions of maximal likelihood that are distinct from one another. That's why the liquid drop models that nate mentions were pretty useful.

The models require as inputs some potentials and form-factors that are not as well understood as those that affect electrons. Further the shell model must be solved numerically in all but the simplest cases so the results are only approximate.

My dissertation work included taking pictures of the shell distributions (of protons only) in momentum space. Here is one view of a carbon nucleus (after considerable manipulation to approximately remove the final state effects):

enter image description here

the horizontal scale is basically binding energy and you can see the p- (high peak on the left) and s-shells (low peak on the right). The lines are to guides the eye only as they have limited physics content.

Spatial distributions of bound objects are related to the momentum distributions by a Fourier transformation. You can't actually work that transformation on this figure because it is in energy rather than momentum space, but you might well guess that there would be a lot of spatial overlap and you would be right.

added 5 characters in body
Source Link
Loading
added 5 characters in body
Source Link
Loading
add image
Source Link
Loading
added 629 characters in body
Source Link
Loading
Source Link
Loading