replaced http://physics.stackexchange.com/ with https://physics.stackexchange.com/
Source Link

From measurements I can tell that weight, as a function of tire pressure increase, is not linear but more something like this:

enter image description here

50kg = 1 change in pressure

100kg = more than 2 changes in pressure, no matter how much that is at this point.

Also the change in pressure is higher for the front seats compared to the rear ones.

Part of a possible explanation: as said, the heavy engine does already influence the front tires more, so the same payload results in a higher pressure increase.

Cons of this explanation (or well maybe/probably the pressures just add up, and the part mentioned before has a higher influence): Of course also the position plays an important role. In the rear you sit much more directly on the rear tires while in the front seats you are pretty much in the middle between rear and front tires.

In the front, the pressure increase is better distributed. Lets say 500 total increase when I sit in the front left, then alone 200 are on the front left but also 200 are on the rear left. When I sit though in the back, more than 300 of the 500 is from the tire where I sit. A better distribution should be like 50kg here and 50 there and this results in a total increase of less than 100kg at one spot, looking at the curve.

$pV=nRT$ as far as I remember. I guess for the short time directly after someone enters the car we can assume the tire to be compressed adiabatically and of course the gas energy to be constant, so it simplifies to $p$~$1/V$.

But how do V and p(=F/A) change so that the measurements could be explained? (Measured with 0,03 millibar resolution)

Where does the form of the curve come from?

Of course I read this question's answers: Does car tire pressure change with weight of car load?Does car tire pressure change with weight of car load? and it gave some nice insights. But here I have some empiric data which I cannot explain. For example different pressure change in rear/front seats but mainly where the curves form come from..

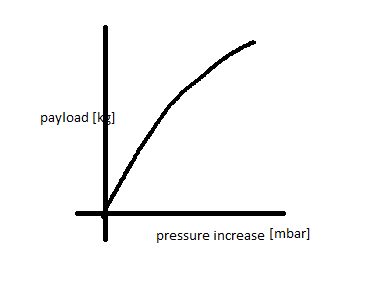
From measurements I can tell that weight, as a function of tire pressure increase, is not linear but more something like this:

enter image description here

50kg = 1 change in pressure

100kg = more than 2 changes in pressure, no matter how much that is at this point.

Also the change in pressure is higher for the front seats compared to the rear ones.

Part of a possible explanation: as said, the heavy engine does already influence the front tires more, so the same payload results in a higher pressure increase.

Cons of this explanation (or well maybe/probably the pressures just add up, and the part mentioned before has a higher influence): Of course also the position plays an important role. In the rear you sit much more directly on the rear tires while in the front seats you are pretty much in the middle between rear and front tires.

In the front, the pressure increase is better distributed. Lets say 500 total increase when I sit in the front left, then alone 200 are on the front left but also 200 are on the rear left. When I sit though in the back, more than 300 of the 500 is from the tire where I sit. A better distribution should be like 50kg here and 50 there and this results in a total increase of less than 100kg at one spot, looking at the curve.

$pV=nRT$ as far as I remember. I guess for the short time directly after someone enters the car we can assume the tire to be compressed adiabatically and of course the gas energy to be constant, so it simplifies to $p$~$1/V$.

But how do V and p(=F/A) change so that the measurements could be explained? (Measured with 0,03 millibar resolution)

Where does the form of the curve come from?

Of course I read this question's answers: Does car tire pressure change with weight of car load? and it gave some nice insights. But here I have some empiric data which I cannot explain. For example different pressure change in rear/front seats but mainly where the curves form come from..

Post Closed as "Duplicate" by ProfRob, John Rennie, ACuriousMind, Kyle Kanos, Bernhard
added 342 characters in body
Source Link

From measurements I can tell that weight, as a function of tire pressure increase, is not linear but more something like this:

enter image description here

50kg = 1 change in pressure

100kg = more than 2 changes in pressure, no matter how much that is at this point.

Also the change in pressure is higher for the front seats compared to the rear ones.

Part of a possible explanation: as said, the heavy engine does already influence the front tires more, so the same payload results in a higher pressure increase.

Cons of this explanation (or well maybe/probably the pressures just add up, and the part mentioned before has a higher influence): Of course also the position plays an important role. In the rear you sit much more directly on the rear tires while in the front seats you are pretty much in the middle between rear and front tires.

In the front, the pressure increase is better distributed. Lets say 500 total increase when I sit in the front left, then alone 200 are on the front left but also 200 are on the rear left. When I sit though in the back, more than 300 of the 500 is from the tire where I sit. A better distribution should be like 50kg here and 50 there and this results in a total increase of less than 100kg at one spot, looking at the curve.

$pV=nRT$ as far as I remember. I guess for the short time directly after someone enters the car we can assume the tire to be compressed adiabatically and of course the gas energy to be constant, so it simplifies to $p$~$1/V$.

But how do V and p(=F/A) change so that the measurements could be explained? (Measured with 0,03 millibar resolution)

Where does the form of the curve come from?

Of course I read this question's answers: Does car tire pressure change with weight of car load? and it gave some nice insights. But here I have some empiric data which I cannot explain. For example different pressure change in rear/front seats but mainly where the curves form come from..

From measurements I can tell that weight, as a function of tire pressure increase, is not linear but more something like this:

enter image description here

50kg = 1 change in pressure

100kg = more than 2 changes in pressure, no matter how much that is at this point.

Also the change in pressure is higher for the front seats compared to the rear ones.

Part of a possible explanation: as said, the heavy engine does already influence the front tires more, so the same payload results in a higher pressure increase.

Cons of this explanation (or well maybe/probably the pressures just add up, and the part mentioned before has a higher influence): Of course also the position plays an important role. In the rear you sit much more directly on the rear tires while in the front seats you are pretty much in the middle between rear and front tires.

In the front, the pressure increase is better distributed. Lets say 500 total increase when I sit in the front left, then alone 200 are on the front left but also 200 are on the rear left. When I sit though in the back, more than 300 of the 500 is from the tire where I sit. A better distribution should be like 50kg here and 50 there and this results in a total increase of less than 100kg at one spot, looking at the curve.

$pV=nRT$ as far as I remember. I guess for the short time directly after someone enters the car we can assume the tire to be compressed adiabatically and of course the gas energy to be constant, so it simplifies to $p$~$1/V$.

But how do V and p(=F/A) change so that the measurements could be explained? (Measured with 0,03 millibar resolution)

Where does the form of the curve come from?

Of course I read this question's answers: Does car tire pressure change with weight of car load? and it gave some nice insights. But here I have some empiric data which I cannot explain. For example different pressure change in rear/front seats but mainly where the curves form come from..

added 47 characters in body
Source Link

From measurements I can tell that weight, as a function of tire pressure increase, is not linear but more something like this:

enter image description here

50kg = 1 change in pressure

100kg = more than 2 changes in pressure, no matter how much that is at this point.

Also the change in pressure is higher for the front seats compared to the rear ones.

Part of a possible explanation: as said, the heavy engine does already influence the front tires more, so the same payload results in a higher pressure increase.

Cons of this explanation (or well maybe/probably the pressures just add up, and the part mentioned before has a higher influence): Of course also the position plays an important role. In the rear you sit much more directly on the rear tires while in the front seats you are pretty much in the middle between rear and front tires.

In the front, the pressure increase is better distributed. Lets say 500 total increase when I sit in the front left, then alone 200 are on the front left but also 200 are on the rear left. When I sit though in the back, more than 300 of the 500 is from the tire where I sit. A better distribution should be like 50kg here and 50 there and this results in a total increase of less than 100kg at one spot, looking at the curve.

$pV=nRT$ as far as I remember. I guess for the short time directly after someone enters the car we can assume the tire to be compressed adiabatically and of course the gas energy to be constant, so it simplifies to $p$~$1/V$.

But how do V and p(=F/A) change so that the measurements could be explained? (Measured with 0,03 millibar resolution)

Where does the form of the curve come from?

From measurements I can tell that weight, as a function of tire pressure increase, is not linear but more something like this:

enter image description here

50kg = 1 change in pressure

100kg = more than 2 changes in pressure, no matter how much that is at this point.

Also the change in pressure is higher for the front seats compared to the rear ones.

Part of a possible explanation: as said, the heavy engine does already influence the front tires more, so the same payload results in a higher pressure increase.

Cons of this explanation (or well maybe/probably the pressures just add up, and the part mentioned before has a higher influence): Of course also the position plays an important role. In the rear you sit much more directly on the rear tires while in the front seats you are pretty much in the middle between rear and front tires.

In the front, the pressure increase is better distributed. Lets say 500 total increase when I sit in the front left, then alone 200 are on the front left but also 200 are on the rear left. When I sit though in the back, more than 300 of the 500 is from the tire where I sit. A better distribution should be like 50kg here and 50 there and this results in a total increase of less than 100kg at one spot, looking at the curve.

$pV=nRT$ as far as I remember. I guess for the short time directly after someone enters the car we can assume the tire to be compressed adiabatically and of course the gas energy to be constant, so it simplifies to $p$~$1/V$.

But how do V and p(=F/A) change so that the measurements could be explained? (Measured with 0,03 millibar resolution)

Where does the form of the curve come from?

Typos and sintax
Source Link
user81619
user81619
Loading
Source Link
Loading