2
$\begingroup$

In the frequency spectrum of every real audio sample that I've ever seen, the amplitude of the frequency components is always higher at low frequencies, then rapidly falls off at higher frequencies.

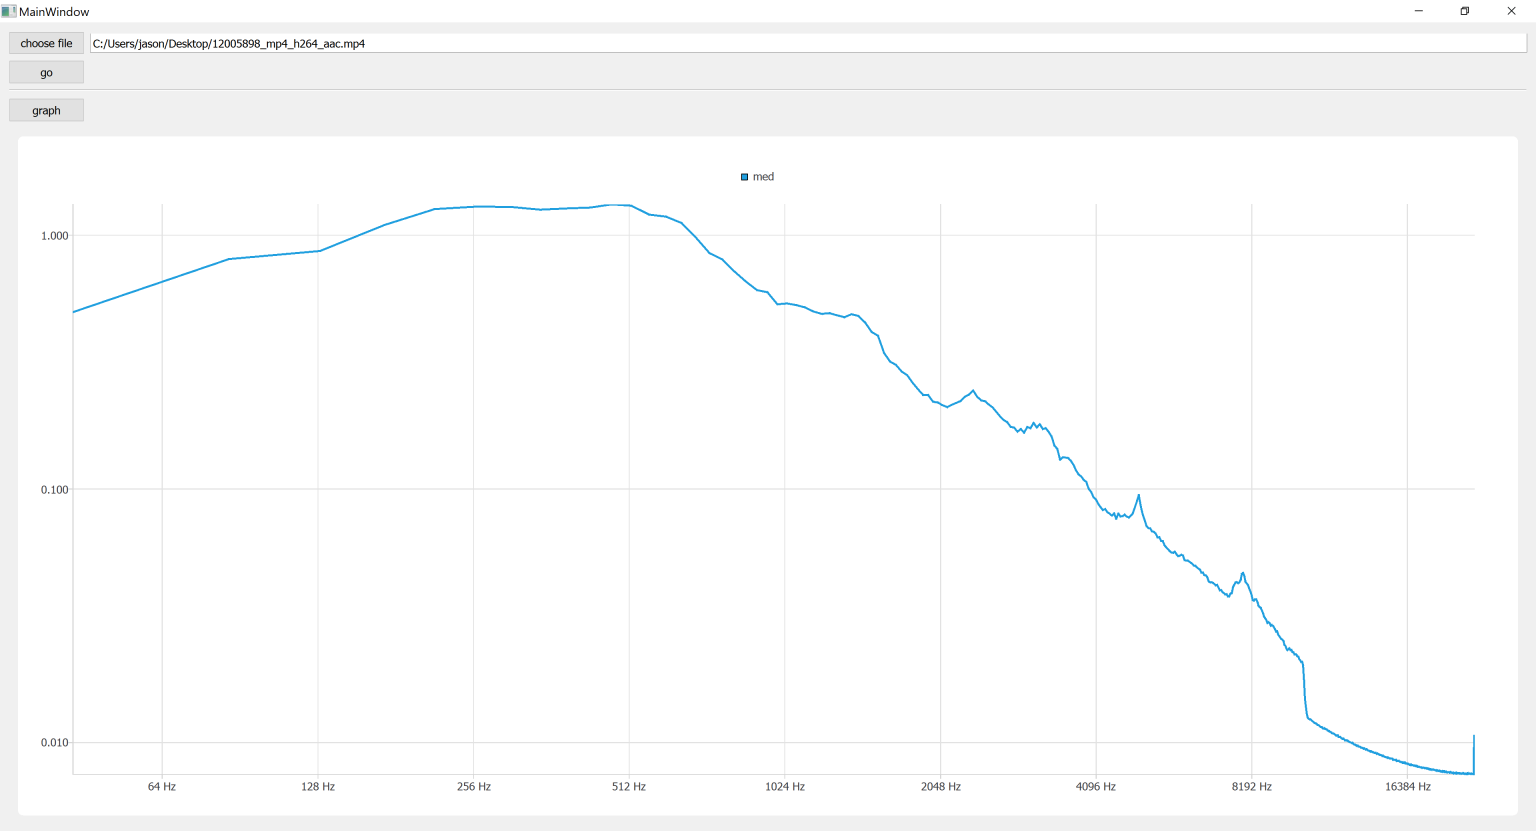
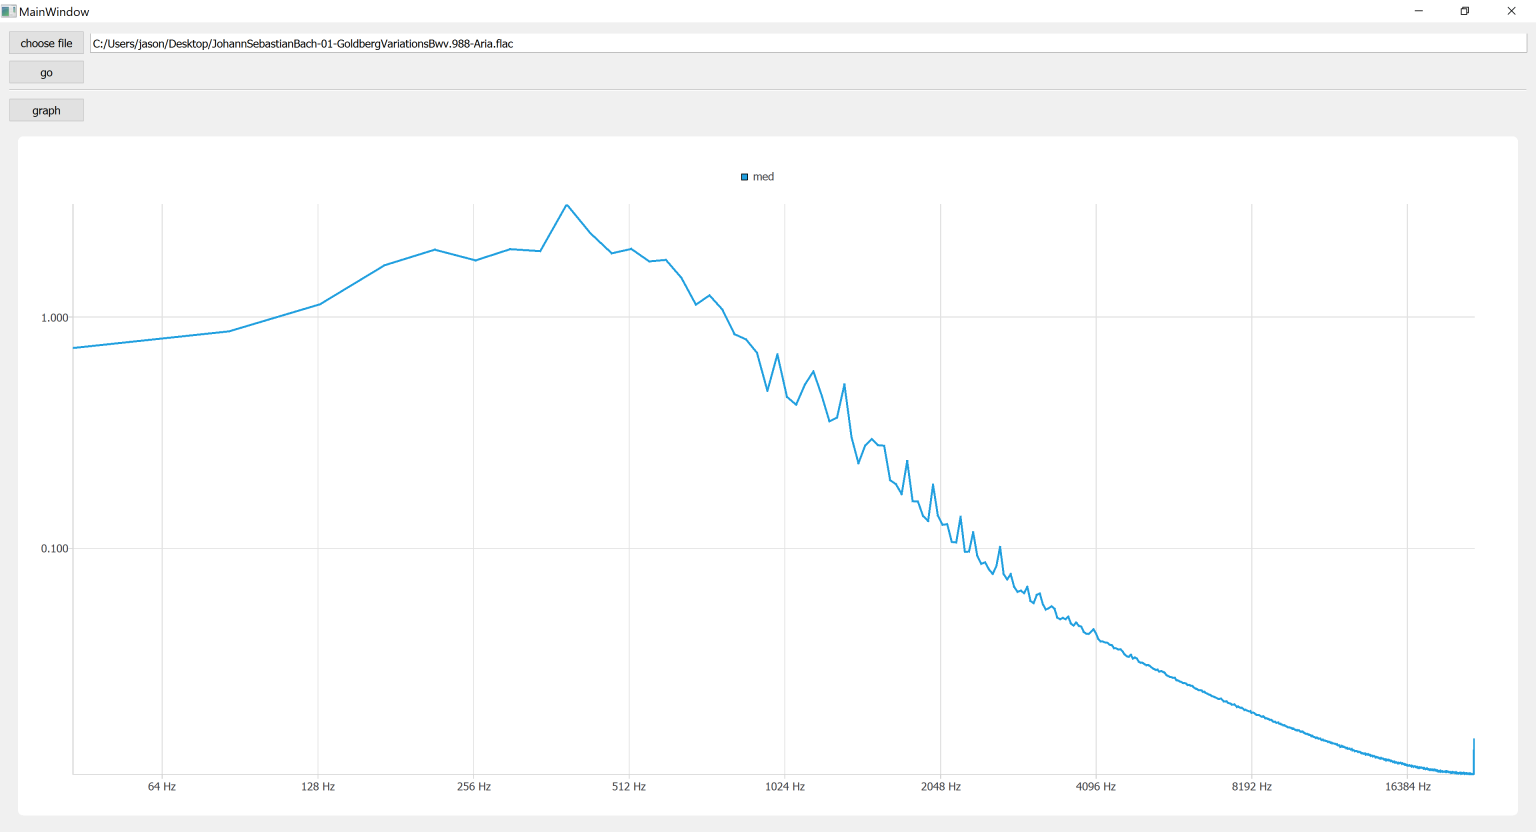
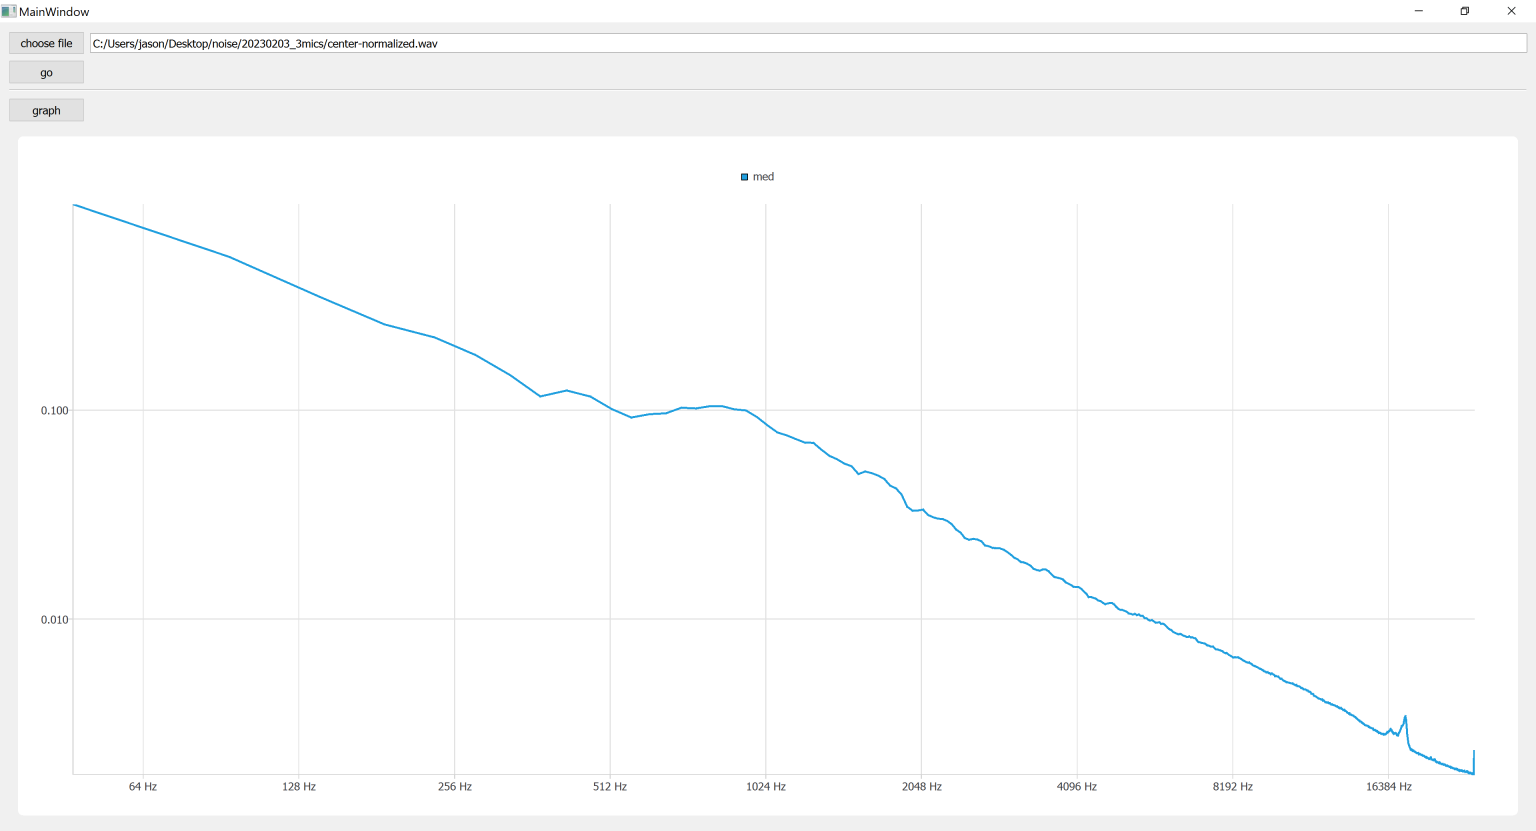
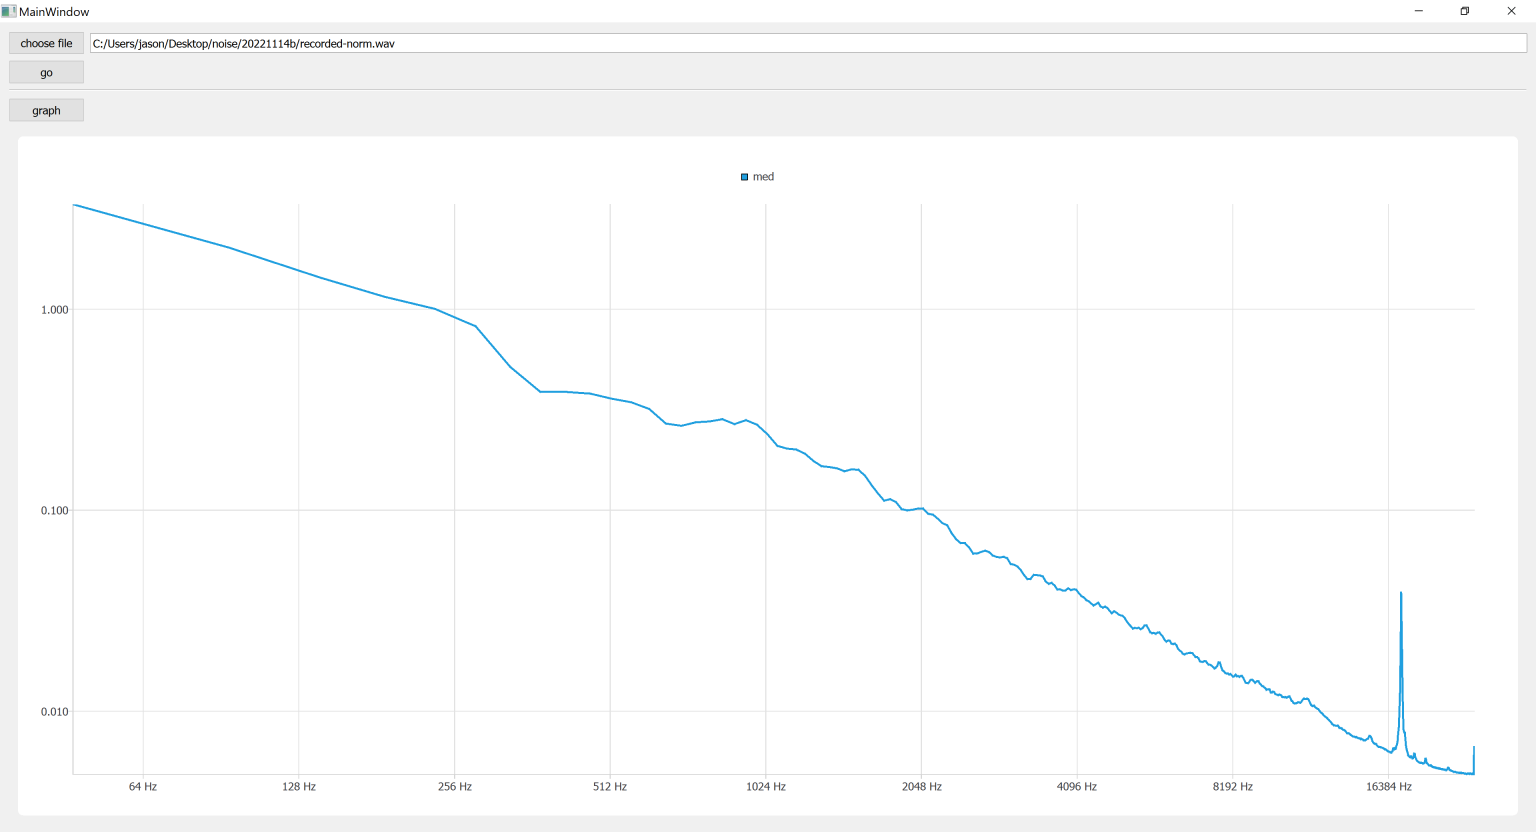
For example, each of the following plots displays the median amplitude vs. frequency with a $\log_{10}$ amplitude axis (Y) and a $\log_{2}$ frequency axis (X). The values for each were computed with a series of FFTs over the entire sample in blocks of 8,192 samples (the amplitudes are calculated as the magnitudes of the complex results):

Recorded Audio (90 minutes of city traffic) Recorded Audio (30 minutes of city traffic)
enter image description here
Recorded with a calibrated flat-response signal analysis mic. Recorded with an uncalibrated flat-response signal analysis mic.
Television Audio Classical Music
enter image description here img
Mostly vocals, presumably mastered for production, encoded as lossy AAC. Presumably mastered for production, encoded as lossless FLAC from source.

Note that in each plot, there is a steep fall-off of signal amplitude (remember these are logarithmic axes) as the frequency increases.

Why is this the case?

Does it have something to do with properties of sound in air? Or is it somehow related to a connection between power, amplitude, and frequency? Or is it just some consequence of DFTs that I don't understand? I see it consistently, all the time.

Also, is there predictable math behind the falloff that I can use to "normalize" the results i.e. flatten the curves for analysis purposes?

I know it's not just a result of production mastering because it appears in unmodified signals. I know it's not just a characteristic of the city noise I recorded because I see it regardless of the sound source (I've recorded ambient sounds in nature that also show the same profile). I know it's not just wind noise (except perhaps the very bottom end) because I see it in studio recordings as well.

Interestingly, in the two charts on top – which are signals I recorded myself with calibrated flat-response signal analysis microphones (in a gain range with minimal distortion) and no further filtering applied — the falloff seems linear in the $\log_{10}$ amplitude and $\log_2$ frequency space, but I don't know if this is a hint to what's going on or not.


Note: The mics on the recorded audio are electret mics with fairly flat response up to about 24kHz, with blips in the response compensated for by a post-recording filter, available from the manufacturer, specific to each mic's serial #. They're designed for signal analysis rather than general recording. I've got the response graphs laying around somewhere I'll scan them if I find them. But it seems like it doesn't affect the answers. In my experience they pick up highs (bird calls, mechanical squeaks, electronic coil ring) with good accuracy.

$\endgroup$
5
  • $\begingroup$ Just think of it what sound is. It is the mechanical vibration of the propagating medium, so it can never have shorter wavelength than the average distance between the neighboring molecules. In practice, of course, the lower limit is nowhere near that but the point is that there is a lower limit to the wavelength. $\endgroup$
    – hyportnex
    Commented Feb 17, 2023 at 2:38
  • 1
    $\begingroup$ @hyportnex If we assume 4nm average molecular spacing in air at STP, that puts the frequency cap around 8.5GHz, so it seems like maybe that's not impacting the results here? At 48kHz the wavelength is ~7.1mm, which is about 6 orders of magnitude higher than the molecular spacing (there's about 1.7 million air molecules in that wavelength). $\endgroup$
    – Jason C
    Commented Feb 17, 2023 at 16:55
  • $\begingroup$ I was commenting on acoustic waves having a natural upper frequency as compared to EM waves that do not have, at least they do not have in classical EM. That you have another 6 orders of magnitude between what you get at 4nm and 4mm does not negate what I said. $\endgroup$
    – hyportnex
    Commented Feb 17, 2023 at 18:05
  • 1
    $\begingroup$ Yeah I know it doesn't negate what you said (I wasn't trying to do that), I'm just wondering if it can account for the attenuation in the range I observed. :) $\endgroup$
    – Jason C
    Commented Feb 17, 2023 at 18:07
  • 1
    $\begingroup$ if you take an ideal crystal you get a very high phonon frequency as an absolute limit. Now if you throw around a few dislocations covering a few thousand lattice distances and thus scattering and absorbing your waves around, you may already have explained with vigorous handwaving some two to three orders of missing magnitudes... $\endgroup$
    – hyportnex
    Commented Feb 17, 2023 at 18:31

3 Answers 3

5
$\begingroup$

Additionally to the answer by Bulbasaur, it is important to highlight that you look at the amplitude $A$ of frequency components, not their power $P$. The relation between them is[1] $$P(\omega) = \frac{1}{2} \mu v \omega^2 A^2,$$ where $\mu$ is the mass density of the medium (e.g. air), $v$ is the speed of sound in that medium and $\omega$ is the angular frequency ($2\pi$ times the frequency) of the wave. Assuming you had a source which emits sound at all frequencies with the same power $P(\omega) = P$, the amplitude would drop as $A \sim \frac{1}{\omega}$. One can see this by solving the above equation for $A$: $$A = \frac{1}{\omega} \sqrt{\frac{2 P}{\mu v}}$$ Note that in this 1D example the mass density has units of $[\mu] = \frac{\text{kg}}{\text{m}}$. Together with the units of the other quantities $[v] = \frac{\text{m}}{\text{s}}$, $[\omega] = \frac{1}{\text{s}}$ and $[A] = \text{m}$, the power has units of $[P] = \frac{\text{kg}}{\text{m}} \frac{\text{m}}{\text{s}} \frac{\text{m}^2}{\text{s}^2} = \left( \text{kg} \frac{\text{m}^2}{\text{s}^2} \right) / \text{s} = \frac{\text{J}}{\text{s}}$.

In 3D, the mass density would have units of $[\rho] = \frac{\text{kg}}{\text{m}^3}$ and the above equation calculates the sound intensity $I(\omega)$, i.e. power per area $[I] = \frac{\text{J}}{\text{s} \cdot \text{m}^2}$.

$\endgroup$
4
  • 1
    $\begingroup$ Ahhh, thank you. I definitely get a much flatter looking graph (in log10 anyways) if I plot power instead of amplitude. $\endgroup$
    – Jason C
    Commented Feb 17, 2023 at 16:44
  • $\begingroup$ I'm having trouble working out the actual units for this equation, I've asked about it in a separate question. $\endgroup$
    – Jason C
    Commented Feb 18, 2023 at 19:52
  • 1
    $\begingroup$ @JasonC I've added an explanation about the units here. Admittedly, it was probably confusing because the example was in 1D. $\endgroup$
    – A. P.
    Commented Feb 19, 2023 at 9:58
  • $\begingroup$ Thanks, I really appreciate that. Combined with the info from en.wikipedia.org/wiki/Sound_intensity and en.wikipedia.org/wiki/Sound_power, it all makes a lot more sense now and my math is working out. $\endgroup$
    – Jason C
    Commented Feb 19, 2023 at 14:51
4
$\begingroup$

I think the answer to the question is made up of several points:

  1. High frequency sound waves experience more attenuation during their propagation (generally speaking).
  2. Typical consumer microphones often pick up higher frequency sound waves with a lower amplitude compared to low frequency sound waves due to their frequency response function.
  3. "Naturally" occurring sound sources such as human speech, dog barking, etc. often have a spectrum whose amplitude decreases with increasing frequency.

However, there are also many sound sources in nature, such as noises produced by insects, that have a very low amplitude in the low-frequency range that you probably have not yet looked at.

$\endgroup$
4
  • 1
    $\begingroup$ Why does #1 happen? $\endgroup$
    – Jason C
    Commented Feb 17, 2023 at 16:37
  • 2
    $\begingroup$ @JasonC the basic reason if friction. The air absorbs sound, and the higher frequency, the more absorption. You can actually verify that sound absorption in air is frequency-dependent by noticing that thunder coming from a lightning that happened very far away (many km) sounds like a roar, while a lightning happening mere tens of meters away sounds like crackle. $\endgroup$
    – Ruslan
    Commented Feb 17, 2023 at 16:59
  • $\begingroup$ @Ruslan I see so making sure I understand: Higher frequency = higher vibrational velocities, and since friction goes up with $v^2$, it creates more loss (and more heat) at higher frequencies. Right? $\endgroup$
    – Jason C
    Commented Feb 17, 2023 at 17:02
  • 2
    $\begingroup$ @JasonC The microscopic mechanism is more complicated (see e.g. a tiny overview here). But the overall result is that there's more absorption for higher frequencies. $\endgroup$
    – Ruslan
    Commented Feb 17, 2023 at 17:10
2
$\begingroup$

As Bulbasaur points out, there are many different levels at which one could think about this question. For example, audio samples that were deliberately produced for humans to listen to will naturally fall off quickly at frequencies above the range of human hearing, since there's no need to produce any sound at those frequencies. Moreover, the microphones that are recording the data are probably calibrated to have the highest sensitivity within the human auditory range. And atmospheric properties limit the propagation through air of sound with very high frequency.

But I think that the most fundamental answer to your questions comes from Plancherel's theorem. The instantaneous power of an audio signal $A$ is proportional to the square of its amplitude. On physical grounds, it's reasonable that the total energy contained in the signal $$E \propto \int_{-\infty}^\infty |A(t)|^2\, dt$$ must be finite. But Plancherel's theorem gives that $E$ is also proportional to the frequency-space expression $\int_{-\infty}^\infty |A(f)|^2\, df$. In order for this integral to converge, $A(f)$ must fall off to zero as $f \to \infty$ - and in fact, it must fall off faster than $f^{-\frac{1}{2}}$.

$\endgroup$
1
  • $\begingroup$ (Fwiw the mics on the recorded audio are electret mics with fairly flat response up to about 24kHz, with blips in the response compensated for by a post-recording filter, available from the manufacturer, specific to each mic's serial #. They're designed for signal analysis rather than general recording. I've got the response graphs laying around somewhere I'll scan them if I find them. But it seems like it doesn't affect the answers.) $\endgroup$
    – Jason C
    Commented Feb 17, 2023 at 16:28

Your Answer

By clicking “Post Your Answer”, you agree to our terms of service and acknowledge you have read our privacy policy.

Not the answer you're looking for? Browse other questions tagged or ask your own question.